Repository navigation
Spatial Graph Studio
GraphPaper 0.6.0 · Documentation source · Suggest an edit
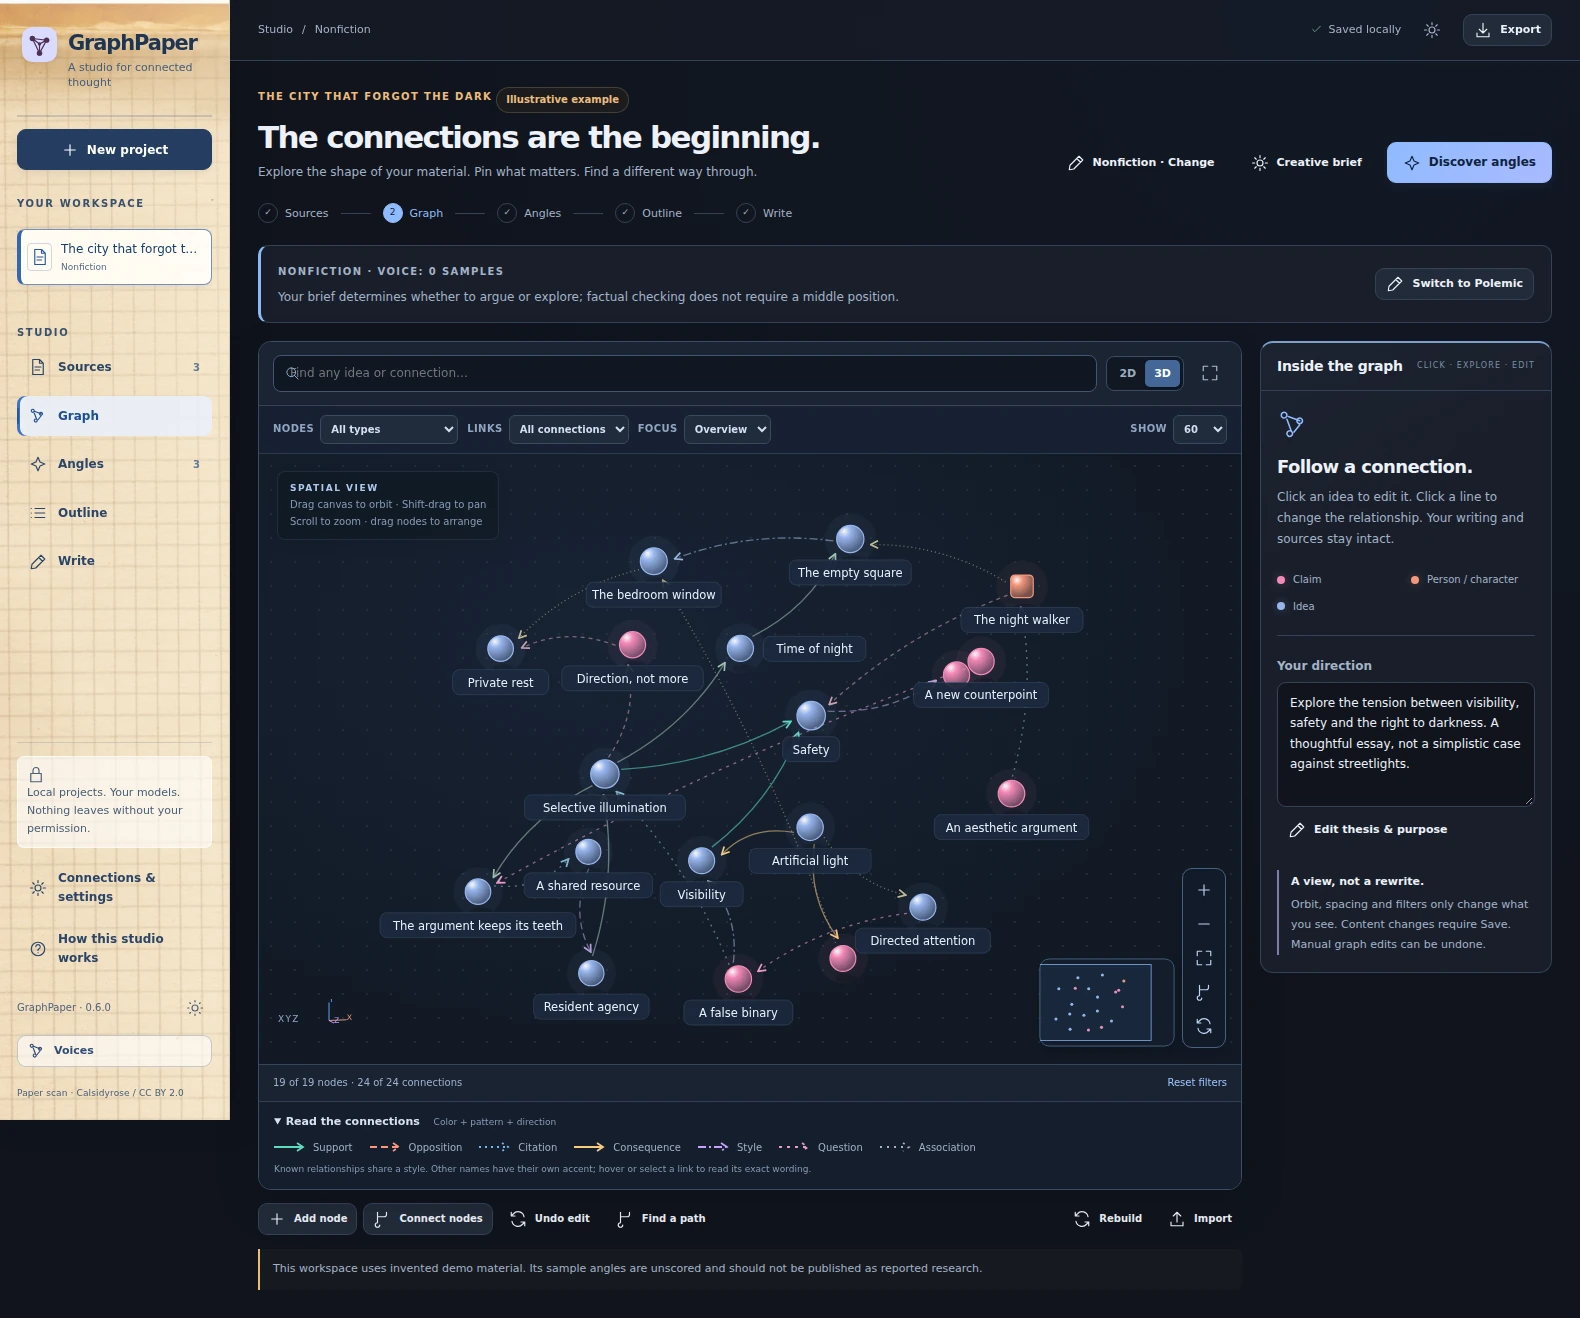 Actual v0.6 graph workspace using the included illustrative example. Capture details.
GraphPaper 0.6 replaces the green-on-green interface with charcoal/ink-blue surfaces, colored graph semantics and a real scanned sheet of graph paper in the sidebar. The sidebar asset is bundled locally; viewing it does not call an image service or require an internet connection. Attribution appears at the bottom of the sidebar and in the package's ASSET-CREDITS.md.
Open any existing project's Graph tab. You do not need to rebuild the graph or upload its documents again.
3D is a spatial XYZ layout rendered with perspective, depth sorting and scalable SVG—not a prerecorded animation or a picture. Drag the background to orbit. Hold Shift and drag to pan. Use the wheel or + / − to zoom. Drag an individual node to arrange it. Fit graph brings the displayed nodes back into view; Reset camera restores the initial orientation; Spread nodes apart increases spacing. The minimap recenters the displayed view when clicked. Expand graph provides more room; Escape leaves the expanded view. Switch to 2D for a flat, pannable diagram at any time.
This implementation does not require WebGL, an external graph service, or an extra model call. It runs within the existing Windows WebView2 and local browser interfaces. It is a genuinely rotatable spatial view using an SVG renderer, not a GPU/WebGL scene. There is no perpetual force simulation, auto-orbit or animation competing with reading.
The camera and manually arranged positions are stored on this device per project. They are view settings, not factual graph changes. They are not presently included in portable project exports.
The initial view shows at most 60 nodes. Choose 40, 60, 100 or 180 in Show. At most 360 links are drawn at once. The footer reports how much of the stored graph is being displayed. These are display budgets, not extraction or storage limits: the undisplayed data remains in the project.
Search examines the whole graph, including titles, notes and relationship names, so a low-degree idea outside the initial overview is still reachable. Type filters select node kinds; connection filters select relationship families. Click a node and choose Focus here, or select 1 hop / 2 hops, to isolate its neighborhood. Reset filters returns to the overview. Adaptive labels reduce collisions at distant zoom levels; select or hover an item for its full name.
Node kinds use distinct colors and shapes: sources are blue squares, claims rose circles, themes cyan diamonds, evidence violet hexagons, and tensions/questions amber triangles. Imported type labels are retained; unrecognized types use the generic idea style.
Relationships use color and line pattern and arrow direction. The legend identifies support, opposition, citation, consequence, style, question and association families. Other relationship names receive a stable accent/pattern, with their exact text available on hover or selection. Classification is deliberately lexical; a colored line does not prove causation or validate the relationship. Existing source/target direction is preserved.
Click a connection itself or choose it in the selected node's connection list to inspect its endpoints and wording. On a crowded overview only active/nearby labels are emphasized; unrelated connections fade after selection.
Click a node to edit its Title, Type and Notes in the inspector, then choose Save node. Click a line to edit From, To, Relationship and Notes, then Save connection. Names and wording are yours; the editor does not filter power language or call a writing model.
Add node creates a new idea. Connect nodes opens an endpoint-and-relationship dialog. Alternatively select a node, choose Connect…, and click the destination node. Deleting asks for confirmation. A node deletion removes that node and its incident edges, not the original documents, voice profile or manuscript.
Manual changes retain original source anchors and mark changed material as proposed. An old quote remains available to inspect; it does not automatically prove an edited claim. Existing generated angles and outlines remain stored and become outdated where applicable. No prose is silently regenerated.
Undo edit reverses up to 25 recent manual graph edits in this local project database. Graph and history commit atomically with version checks. Undo refuses to overwrite a graph that has since been rebuilt or replaced. It does not restore or overwrite the manuscript. Independent pin choices made after an edit are retained.
Unsaved inspector edits are guarded when changing selection or leaving the graph. Native close asks you to save/discard/stay rather than losing the inspector text; Ctrl+S saves the active graph edit. Browser close uses its unsaved-change warning. Editing is blocked while an extraction/writing job is active.
The image is “Graph paper notepad (4562203394)” by Calsidyrose, a scan of actual vintage graph paper, licensed CC BY 2.0. It was resized and converted to WebP; no generated picture is substituted for the paper. Original and bundled checksums are in ui/assets/graph-paper.json.
.jpg)
Automated checks exercise persistent node/edge edits, stale-write rejection, provenance preservation, deletion/undo, spatial transforms, rendering limits and full-graph search. Browser checks use an isolated synthetic 600-node/1,500-edge graph as well as the small illustrative demo. The Windows release workflow also exercises the compiled executable's graph controls, existing Graphify action, voice reuse, native dialogs and save-on-close. The release workflow results—not this feature description—record which runs actually passed. No private manuscript or user computer is part of these tests.