


SwitchDeck is a self-hosted management portal for TP-Link Easy Smart switches on a local network. Instead of logging into each switch's web UI separately, you get one dashboard to monitor them, change port and switch settings, get offline/online alerts, and feed Prometheus and Grafana.
It is a single Go binary with an embedded web UI and a SQLite database. No external services are needed.
Warning
SwitchDeck is an independent project. It is not affiliated with, endorsed by, or supported by TP-Link. It drives the switches' own web interface, and several actions (disabling ports, VLAN/LAG changes, reboot) can cut off network access, including your own. Use it at your own risk, on your own network.
- Features
- Supported hardware
- Screenshots
- How it works
- Installation
- Running
- Configuration
- Prometheus metrics
- Grafana dashboard
- API
- Security notes
- Troubleshooting
- Development
- Contributing
- License
- Multi-switch dashboard: every switch on one page, with a per-port LED strip colored by link state and speed (disabled, down, 10M, 100M, 1G)
- Background polling: one worker per switch refreshes port counters (default every 60 s) and the full configuration (default every 300 s); a TCP probe every 30 s detects offline switches
- Port management: view status, speed and duplex; enable or disable ports from the UI; set speed and flow control through the API
- Custom port names: rename ports inline in the ports table; names are used in the UI, in Prometheus labels and in backups
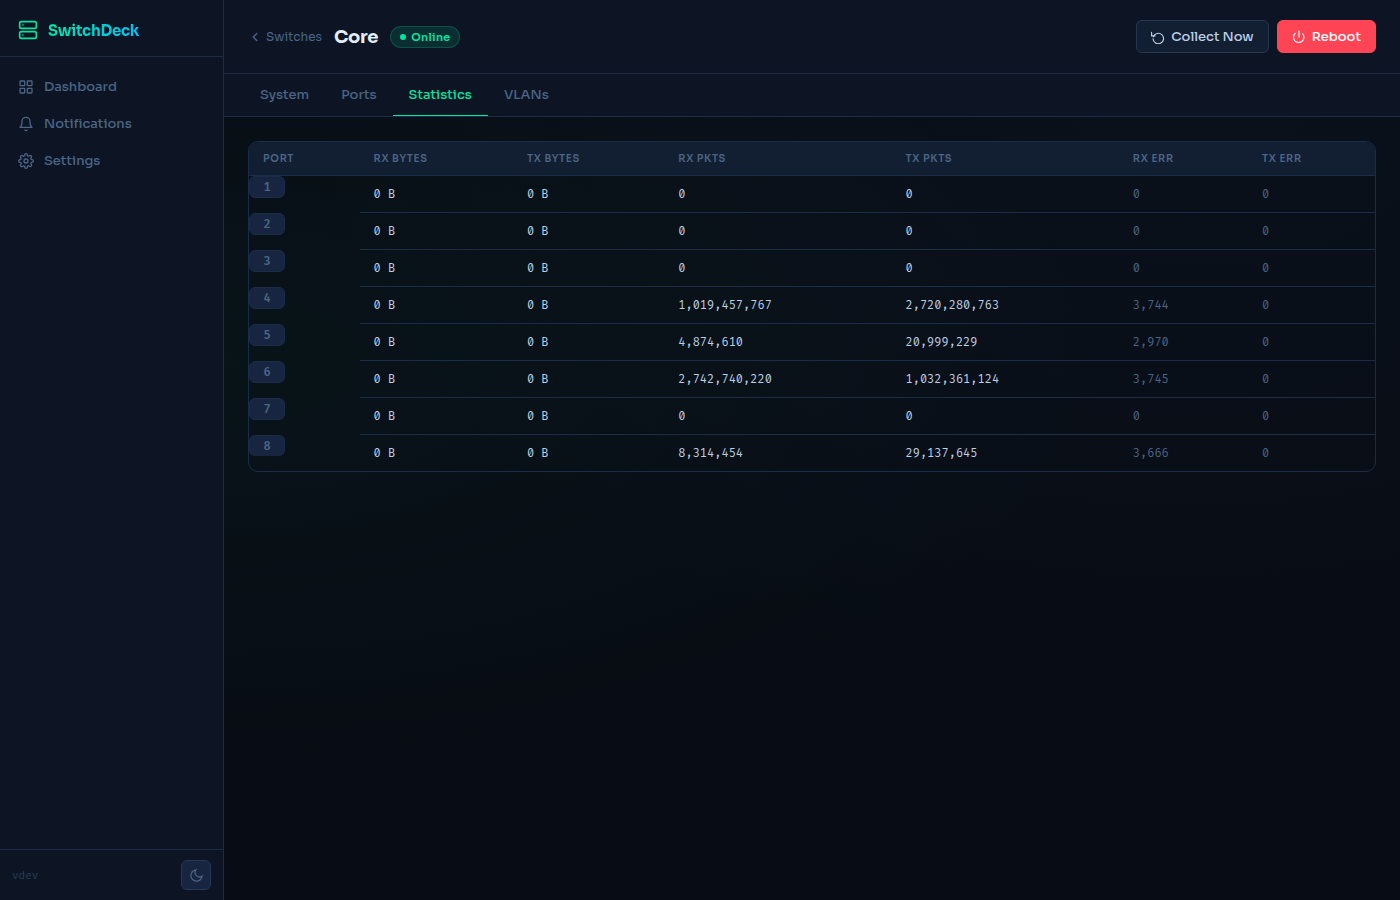
- Port statistics: per-port good/bad packet counters (TX/RX), with a counter reset through the API
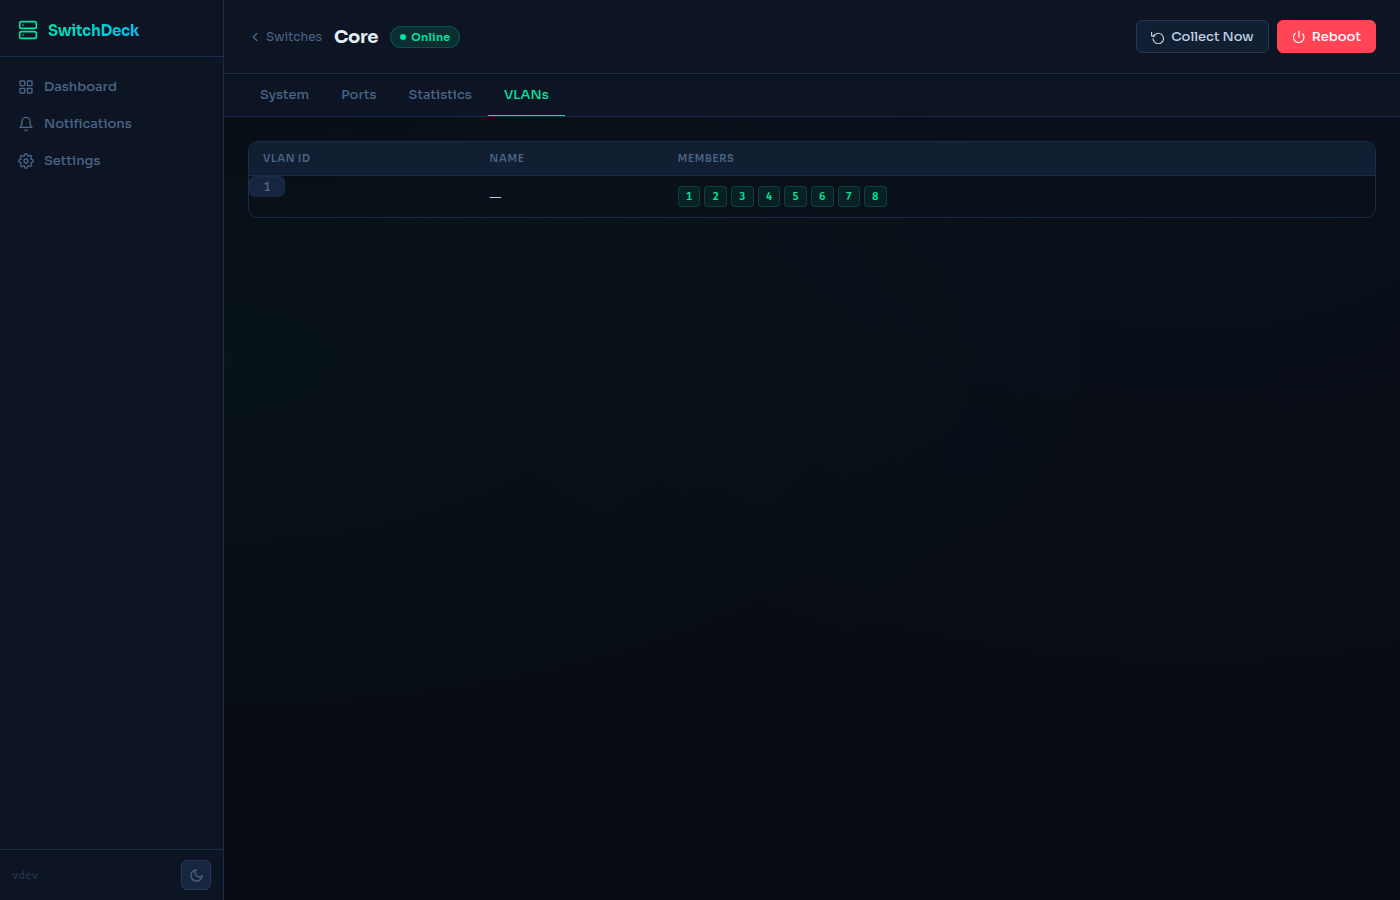
- VLANs: view 802.1Q VLANs and port membership; write VLAN configuration through the API
- More switch settings through the API: LAG (static trunks), port mirroring, QoS mode and port priority, storm control, IGMP snooping and loop prevention
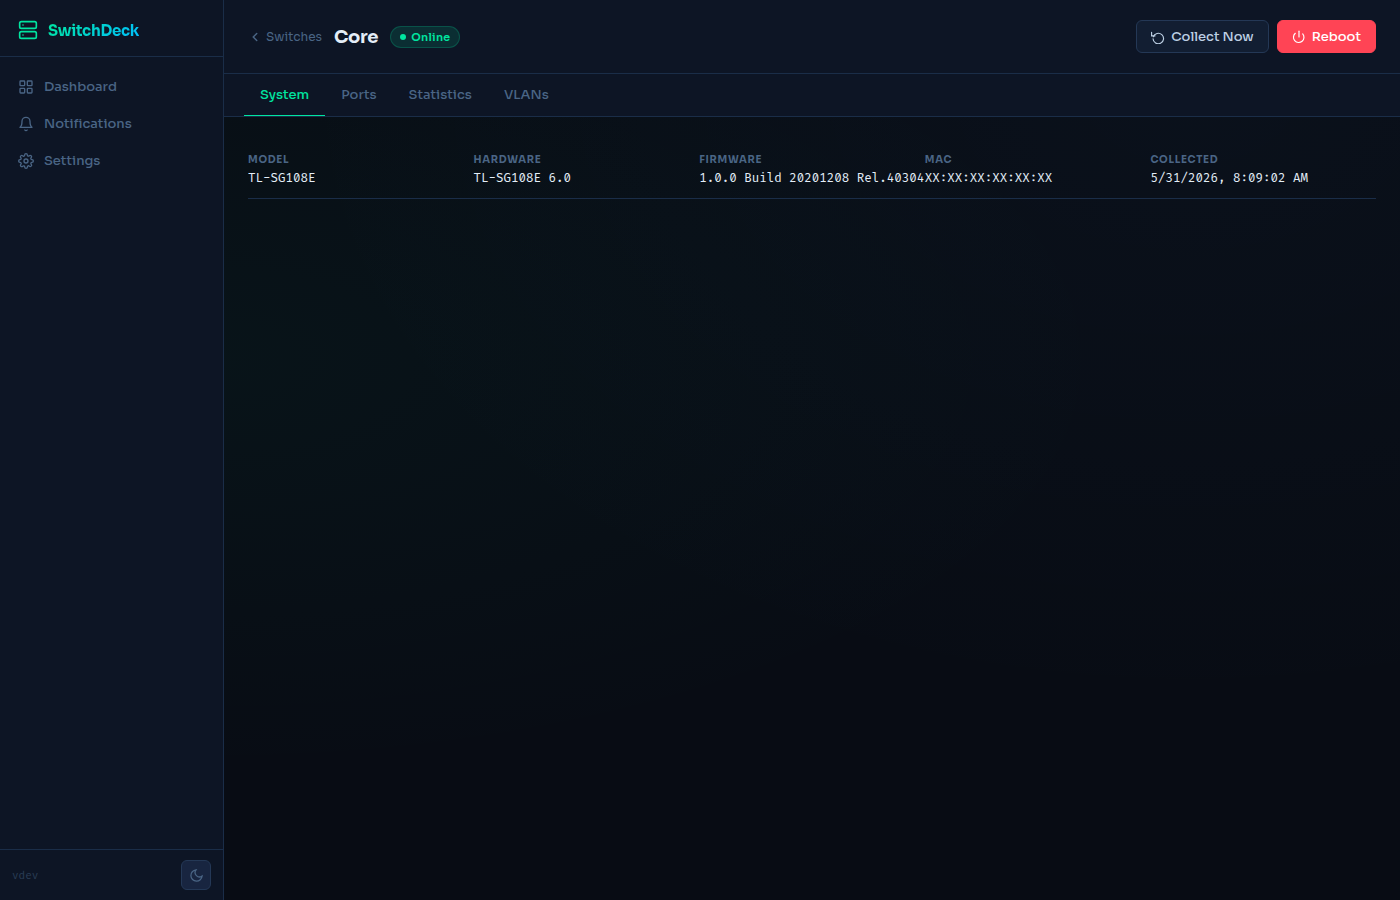
- System information: model, hardware and firmware version, MAC address, last-collected time
- Notifications when a switch goes offline or comes back online, through Shoutrrr (Slack, Discord, Telegram, SMTP, ntfy, Gotify and more), Green-API (WhatsApp) or a self-hosted WhatsApp Web instance
- Authentication (optional): username/password login with argon2id-hashed passwords and HMAC-SHA256 signed session cookies;
--reset-passwordCLI for recovery - API tokens: named bearer tokens with optional expiry for scripts and integrations; stored as SHA-256 hashes and shown only once
- Encrypted credentials: switch passwords and notification settings are encrypted at rest with AES-256-GCM
- Backup & restore: one portable JSON file with switches, port names, login settings, API tokens and notification channels
- Prometheus metrics at
/metrics, served from the in-memory cache, plus a ready-made Grafana dashboard - Dark / light mode toggle (dark by default; the choice is saved in
localStorage) and a responsive layout with a bottom tab bar on mobile - Multi-arch Docker image (
amd64,arm64,armv7) on Docker Hub, and release binaries for Linux, macOS and Windows
SwitchDeck talks to the switch's built-in web interface (/logon.cgi, /SystemInfoRpm.htm, /PortSettingRpm.htm and similar pages).
| Model | Status |
|---|---|
TP-Link TL-SG108E, hardware 6.0, firmware 1.0.0 Build 20201208 Rel.40304 |
Developed and tested against this model (test fixtures and code comments) |
| Other TP-Link Easy Smart models | Untested. Pages that parse may work, but port changes through the API are limited to ports 1–8. |
Not collected by the current TP-Link client: PoE, STP, MAC table and LLDP data. The matching metrics are either missing or always 0 (see Prometheus metrics).
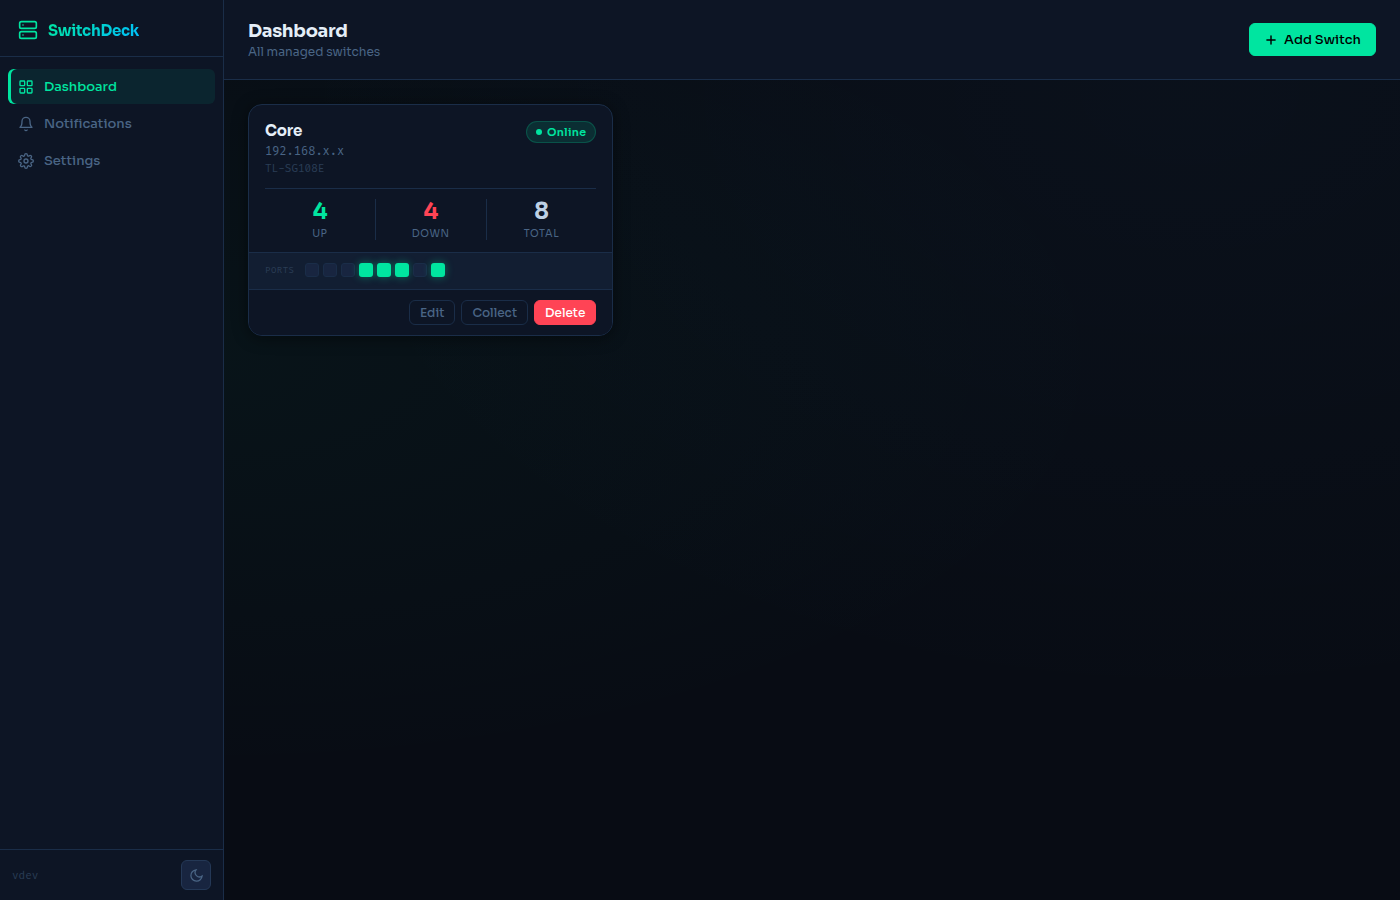
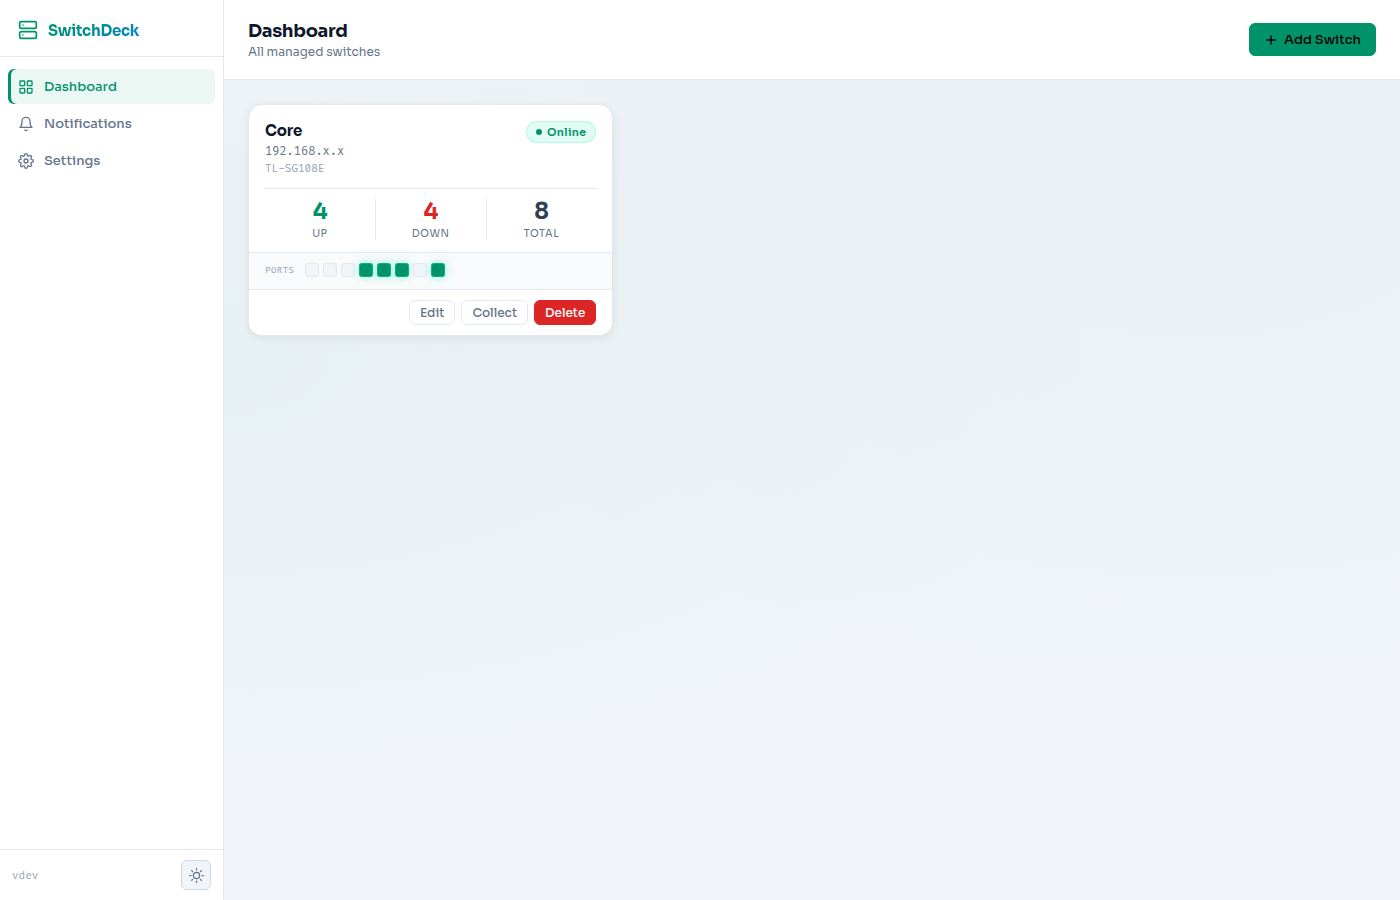
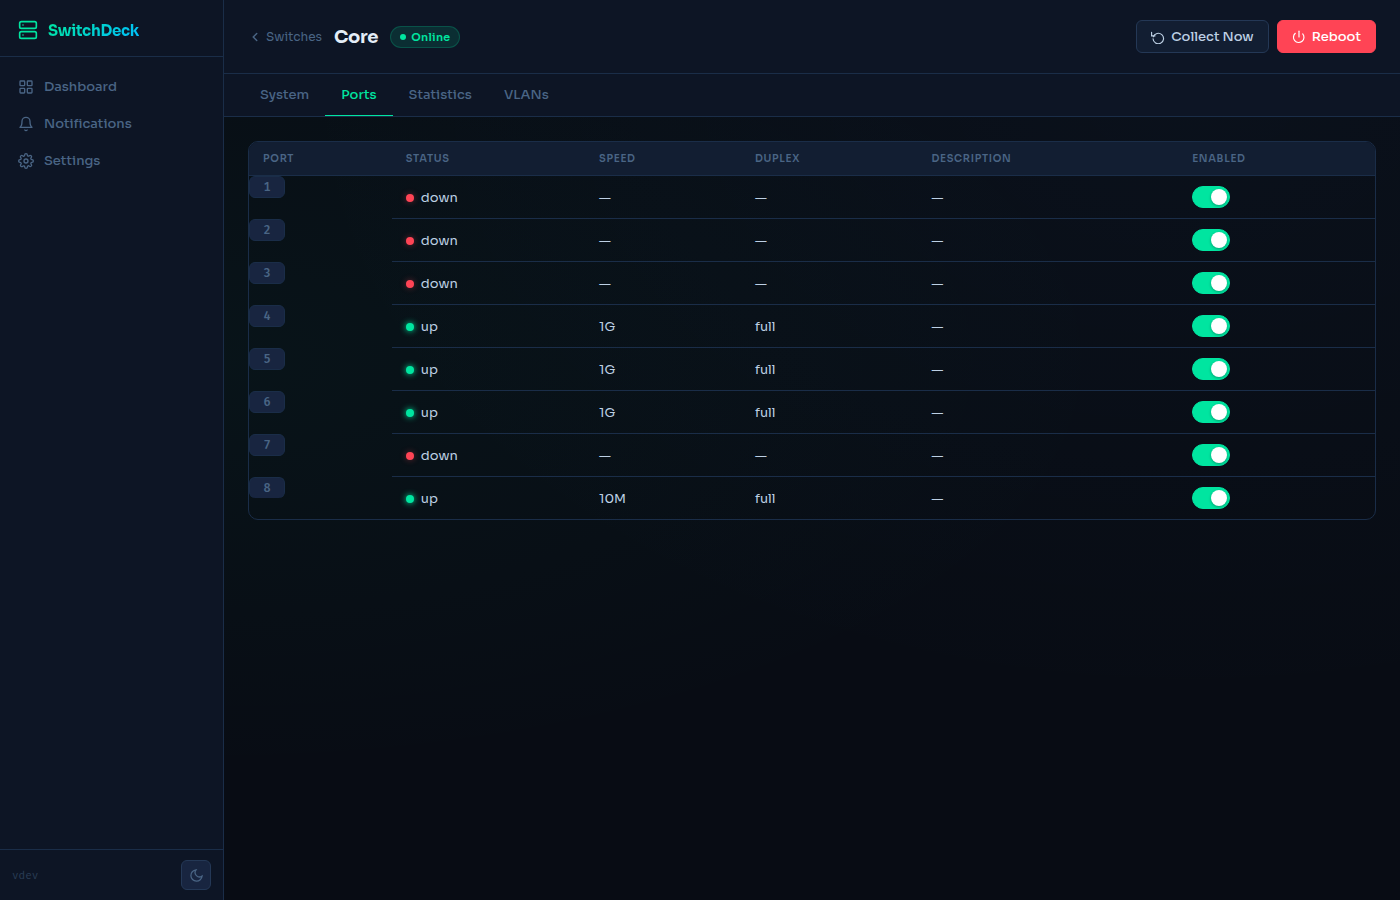
This screenshot predates custom port names (the Name column) and the speed-based port colors.
flowchart LR
    UI[Web UI / API clients] -->|HTTP :8080| API[SwitchDeck API]
    Prom[Prometheus] -->|GET /metrics| API
    API --> DB[(SQLite<br/>switchdeck.db)]
    API --> MGR[Manager]
    MGR --> W1[Worker per switch]
    W1 -->|HTTP login + page scraping| SW[TP-Link switch]
    W1 -->|TCP probe :80 every 30 s| SW
    W1 -->|offline / online| N[Notification channels]
- On startup, SwitchDeck opens
<data>/switchdeck.db, creates an encryption key on first run, and starts a worker for each enabled switch. - Each worker logs in to the switch over
http://<ip>, collects a full snapshot, and then runs three timers:- Stats poll (per switch, default 60 s): re-reads
/PortStatisticsRpm.htm. - Config poll (per switch, default 300 s): re-reads all pages (system, ports, LAG, VLANs, IGMP, QoS, bandwidth, storm control, mirroring, loop prevention, statistics).
- Reachability probe (fixed, every 30 s): a TCP connect to port 80 with a 3 s timeout. After 2 consecutive failures the switch is marked offline and notifications are sent; when it answers again an "online" notification is sent.
- Stats poll (per switch, default 60 s): re-reads
- Each snapshot is kept in memory and saved to SQLite. The UI reads the saved snapshot and
/metricsreads the in-memory copy, so page loads and scrapes never log in to the switches. - Collect / Collect Now starts an immediate full collection with a fresh switch session.
- Write actions (port, VLAN, LAG, reboot, …) are sent straight to the switch using the worker's session.
The image is techblog/switchdeck on Docker Hub (linux/amd64, linux/arm64, linux/arm/v7). It runs as a non-root user (uid 65532) on a distroless base, and stores its database in /data (the image starts with --data /data).
Important
Fix the volume ownership once, before the first start. In the image, /data exists only as a VOLUME and is owned by root, so a fresh volume is not writable by uid 65532. The container then exits with open store: ping db: unable to open database file (14).
- Named volume (used by both examples below, name
switchdeck-data):Docker Compose prefixes volume names with the project name (e.g.docker run --rm -v switchdeck-data:/data alpine:3 chown 65532:65532 /data
switchdeck_switchdeck-data). Either run the command with that name, or addname: switchdeck-dataunder the volume in your compose file, as the example below does. - Bind mount: run
chown 65532:65532 <dir>on the host directory.
Mount the volume at /data. The docker-compose.yml and deployments/docker-compose.yml files in this repo mount it at /data/switchdeck, which doesn't match the image's --data /data, so the database would not be stored in that volume. Use the Compose example below instead.
docker run -d \
  --name switchdeck \
  -p 8080:8080 \
  -v switchdeck-data:/data \
  --restart unless-stopped \
  techblog/switchdeck:latest
Or with Docker Compose:
services:
  switchdeck:
    image: techblog/switchdeck:latest
    ports:
      - "8080:8080"
    volumes:
      - switchdeck-data:/data
    restart: unless-stopped

volumes:
  switchdeck-data:
    name: switchdeck-data
Then open http://localhost:8080.
The volume holds switchdeck.db, which contains the encrypted switch credentials and the key that decrypts them. Keep it (and its backups) private.
Published tags: latest, 2026.5.1 and dev.
Download a binary from the Releases page. Each release ships:
| Platform | File |
|---|---|
| Linux amd64 | switchdeck-linux-amd64 |
| Linux arm64 | switchdeck-linux-arm64 |
| Linux armv7 | switchdeck-linux-arm-armvv7 |
| macOS Intel | switchdeck-darwin-amd64 |
| macOS Apple Silicon | switchdeck-darwin-arm64 |
| Windows amd64 | switchdeck-windows-amd64.exe |
chmod +x switchdeck-linux-amd64
./switchdeck-linux-amd64 --data ./data
Note
The latest release is 2026.5.1 (May 2026), and the latest Docker image is built from it. Custom port names, the speed-colored port LEDs, the switchdeck_port_info metric and the Grafana dashboard were added later. To use them now, build from main.
Requires Go 1.25+. The build is pure Go (CGO_ENABLED=0 works).
git clone https://github.com/t0mer/SwitchDeck.git
cd SwitchDeck
go build -o switchdeck ./cmd/switchdeck
./switchdeck --data ./data| Flag | Default | Description |
|---|---|---|
--port |
8080 |
HTTP listening port (all interfaces) |
--data |
/data/switchdeck |
Data directory; the database is <data>/switchdeck.db. The Docker image passes --data /data. |
--log-level |
info |
Accepted (debug, info, warning, error), but not applied to logging yet |
--version |
— | Print the version and exit |
--reset-password |
— | Set new admin credentials interactively and exit |
There are no environment variables and no config file. configs/config.example.yaml is documentation only and is not read. All other settings live in the database and are managed through the UI or API.
# Custom port and data directory
./switchdeck --port 9090 --data /var/lib/switchdeck

# Reset the admin username and password (prompts on the terminal)
./switchdeck --reset-password --data /var/lib/switchdeck

# Docker: reset credentials inside the running container
docker exec -it switchdeck /switchdeck --reset-password --data /data
GET /health returns {"status":"ok"} and needs no authentication. The Docker HEALTHCHECK only runs /switchdeck --version.
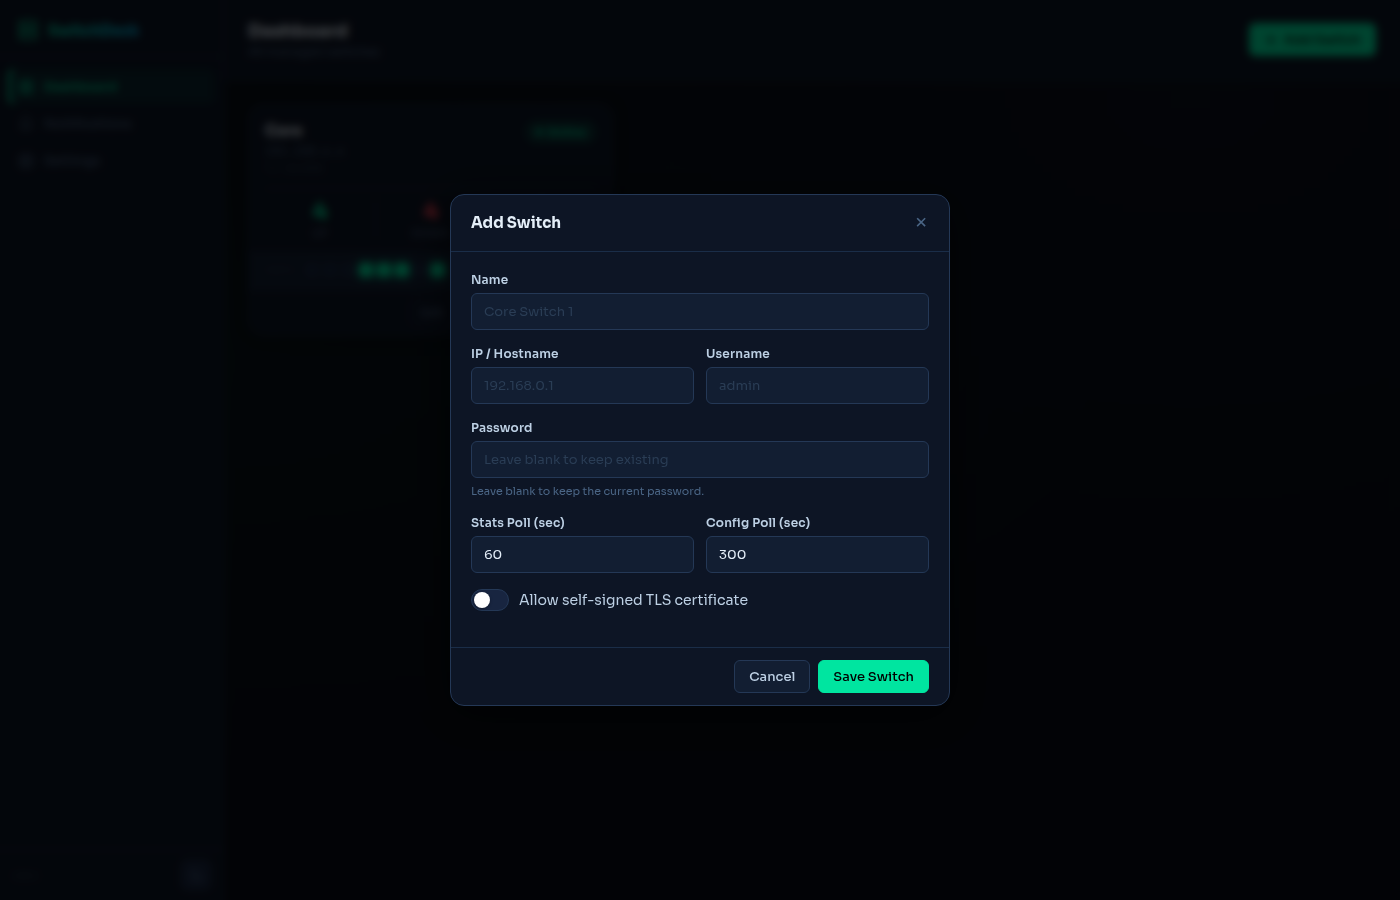
Click + Add Switch on the dashboard:
| Field | Description |
|---|---|
| Name | Display name (e.g. Core, Floor 2) |
| IP / Hostname | Switch management address (e.g. 192.168.0.10) |
| Username / Password | The switch's admin credentials |
| Stats Poll (sec) | How often to refresh port counters (default 60, UI minimum 10) |
| Config Poll (sec) | How often to refresh the full configuration (default 300, UI minimum 30) |
| Allow self-signed TLS certificate | Stored, but currently has no effect: SwitchDeck always connects to switches over plain http:// |
SwitchDeck starts a worker and collects data right after you save.
Important
When you edit a switch, type the password again. The form says "leave blank to keep existing", but the current code saves the field as entered, including an empty password.
On the dashboard each card has Edit, Collect and Delete. The switch page has System, Ports, Statistics and VLANs tabs plus Collect Now and Reboot buttons. On the Ports tab you can toggle a port on or off and rename it.
By default SwitchDeck is open. To require a login:
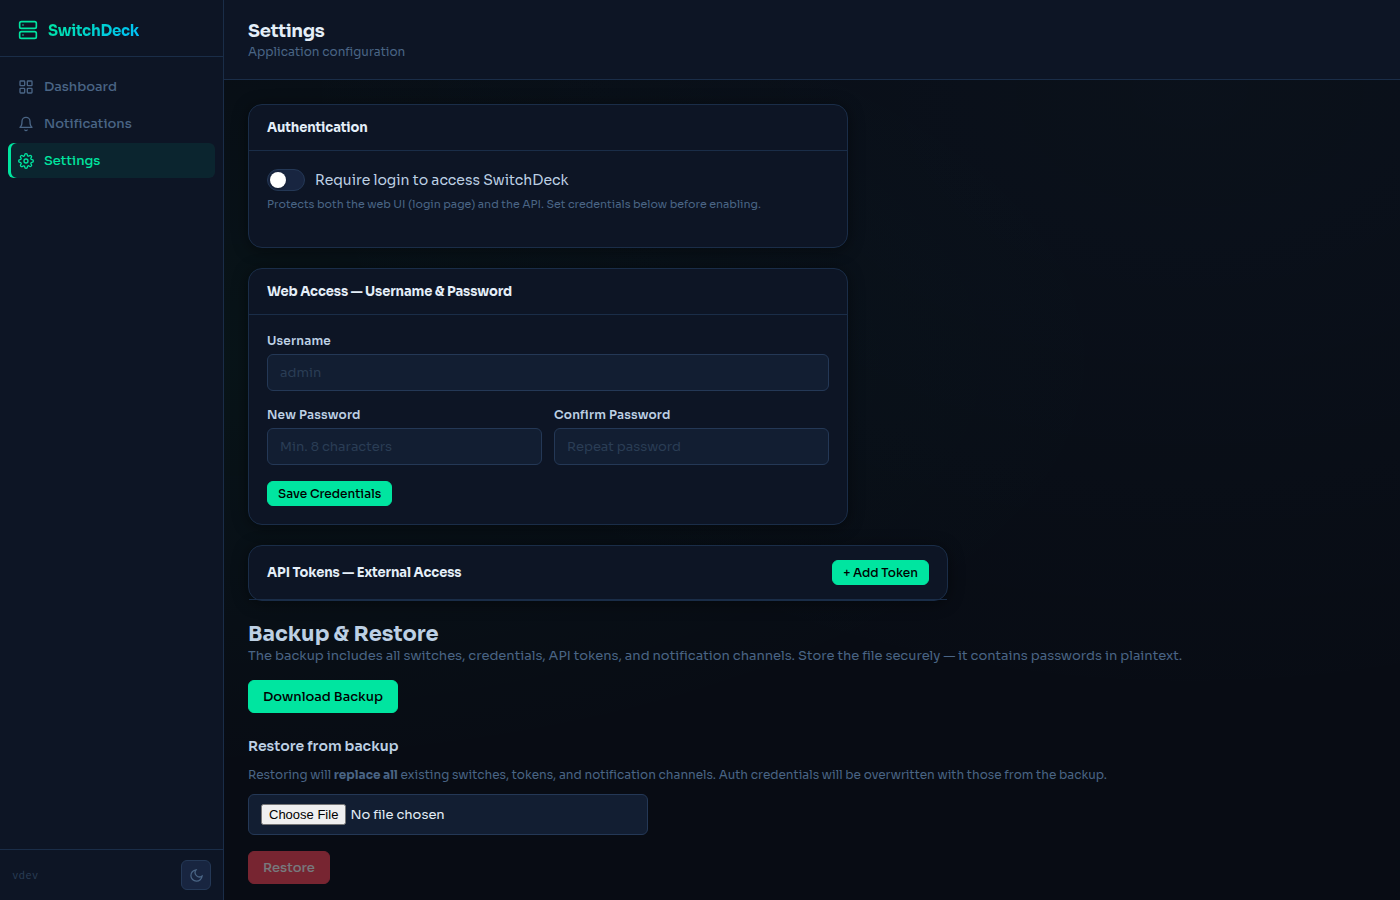
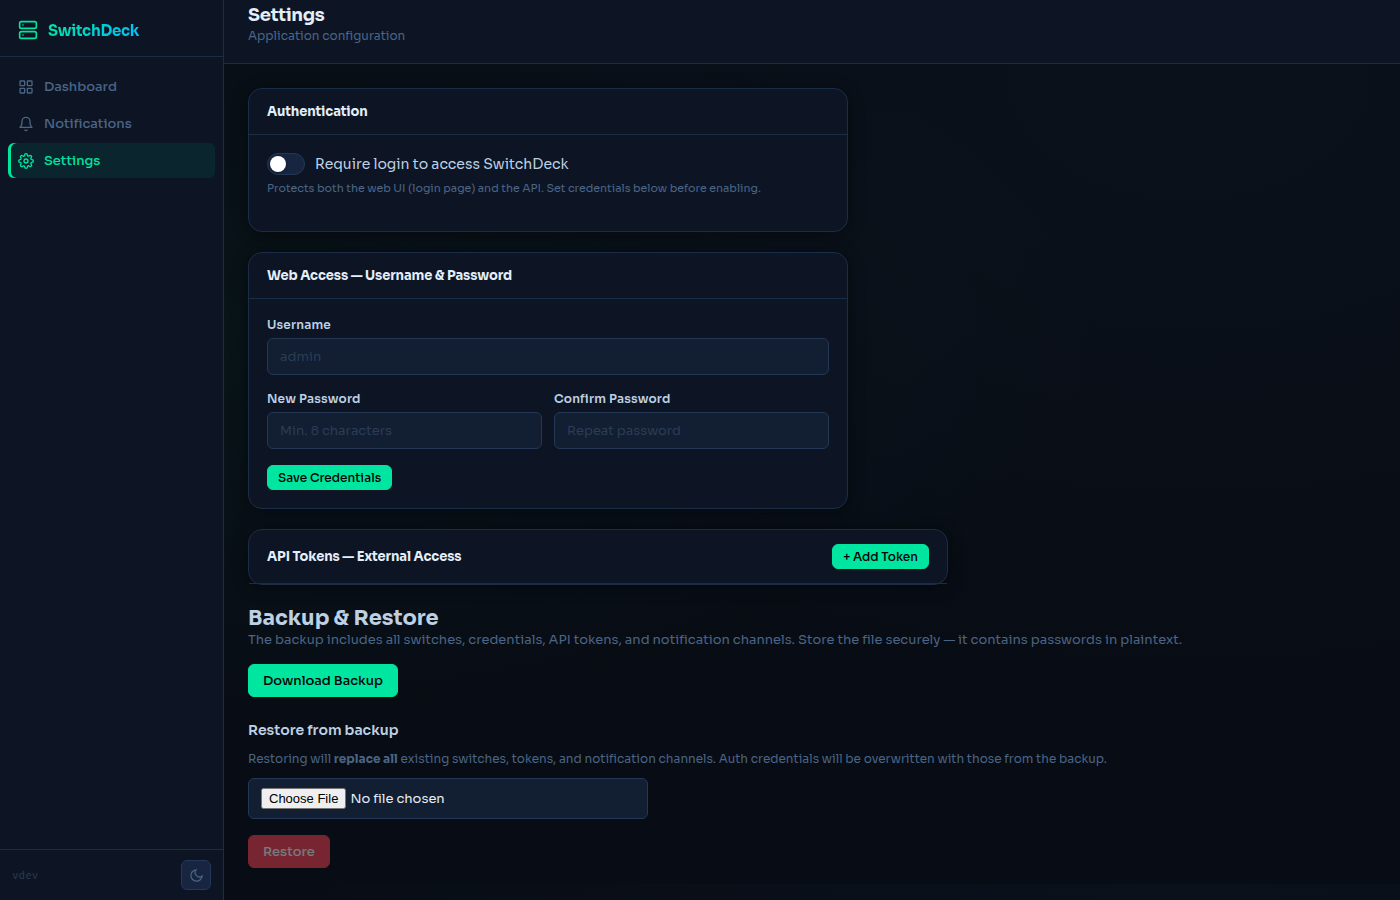
- Open Settings → Web Access, enter a username and a password (at least 8 characters), and click Save Credentials.
- Turn on Require login to access SwitchDeck.
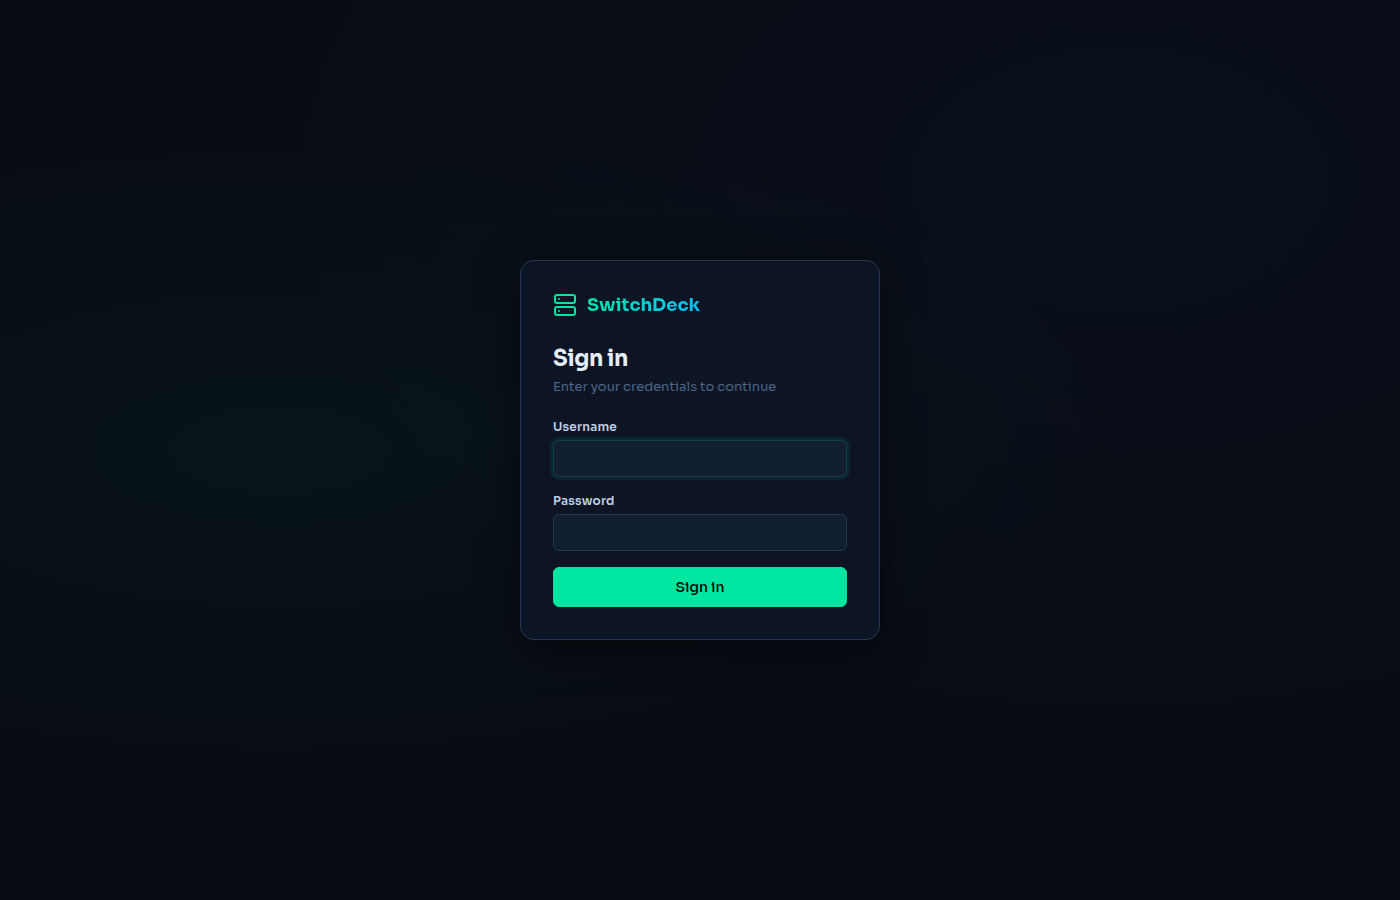
Login is enforced only when it is enabled and a username is set. It then covers all UI pages and /api/v1/*, except the login endpoints. /health, /login, /static/* and /metrics always stay public.
- Passwords are hashed with argon2id.
- Sessions are stateless cookies (
sd_session,HttpOnly,SameSite=Lax, valid for 24 hours) signed with HMAC-SHA256. The signing secret is generated on first use and stored in the database. - Logging out clears the cookie in the browser only.
- If you are locked out, run
--reset-password(see Examples).
For scripts, Home Assistant, monitoring tools and other integrations:
- Open Settings → API Tokens and click + Add Token.
- Enter a name and an optional expiry.
- Copy the token from the confirmation dialog. It is shown only once; SwitchDeck stores only its SHA-256 hash.
curl -H "Authorization: Bearer <token>" http://localhost:8080/api/v1/switchesTokens work on /api/v1/* only, not on the UI pages.
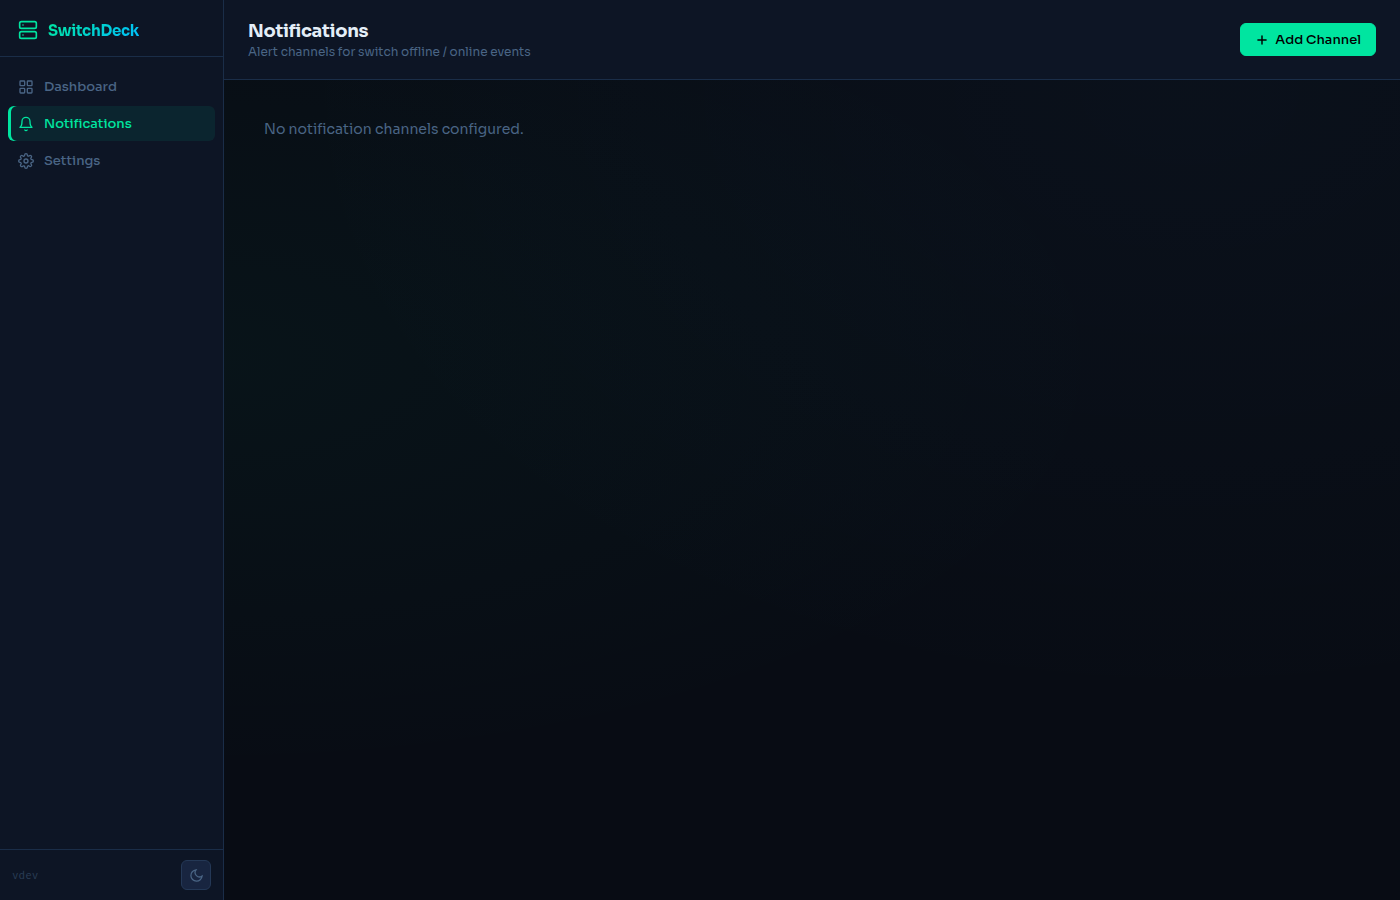
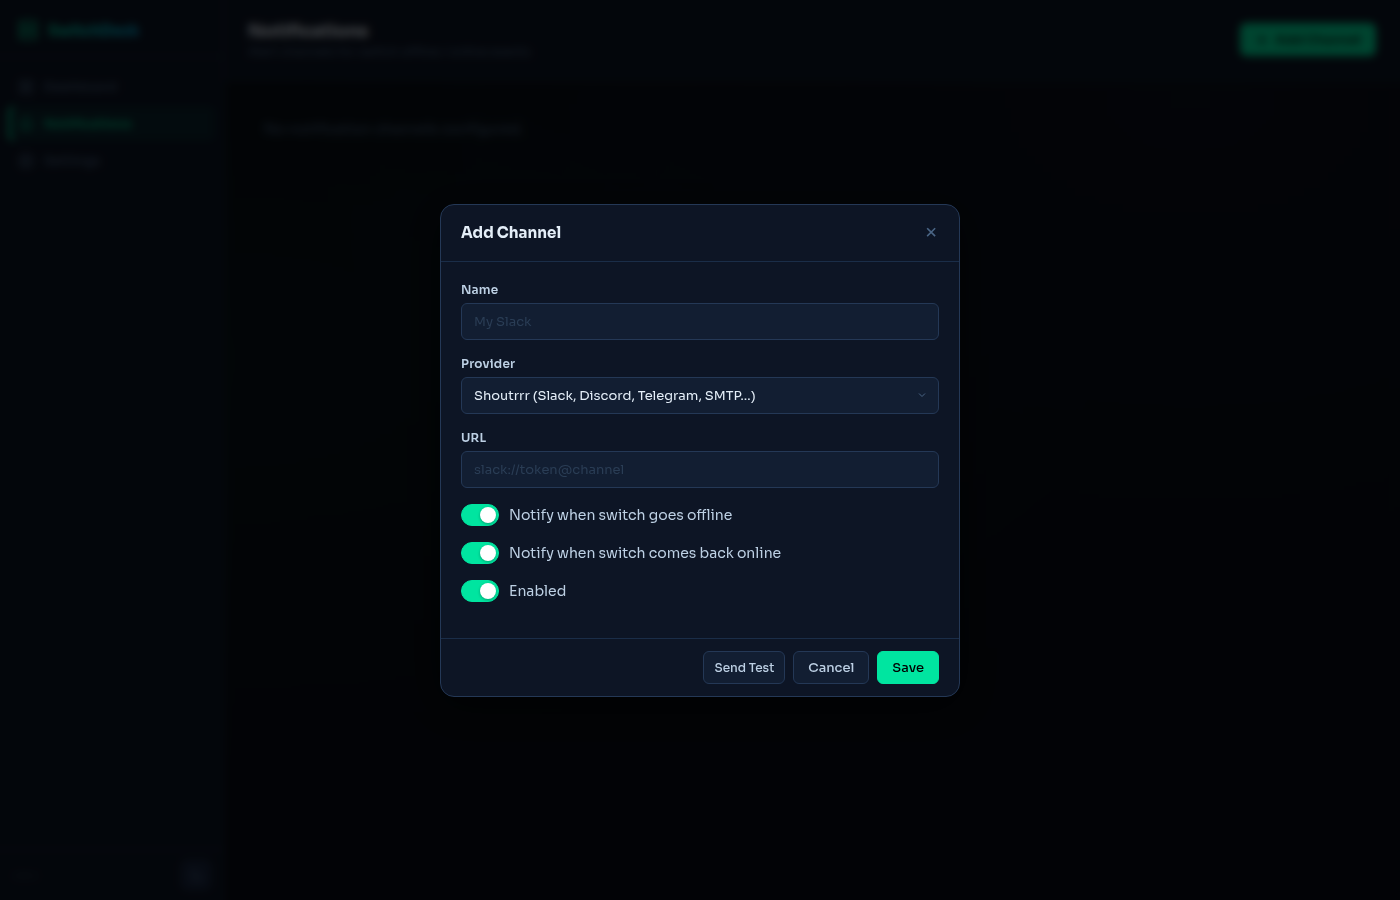
Open Notifications and click + Add Channel. Each channel has a name, a provider, provider settings and three toggles: Notify when switch goes offline, Notify when switch comes back online and Enabled. Send Test sends a real test message with the values in the form before you save.
| Provider | Settings (JSON keys) | Notes |
|---|---|---|
| Shoutrrr | url |
Slack, Discord, Telegram, SMTP, ntfy, Gotify and many more, e.g. slack://token@channel |
| Green-API (WhatsApp) | instance_id, token, recipient, api_url (optional) |
api_url defaults to https://api.green-api.com. Use the international number without + or spaces (e.g. 972501234567); @c.us is appended when the value has no @. |
| WhatsApp Web | base_url, recipient, username, password (optional) |
A self-hosted go-whatsapp-web-multidevice instance; SwitchDeck calls POST <base_url>/send/message, with Basic Auth if a username is set. |
Important
When you edit a channel in the UI, re-enter all provider fields (URL, token, recipient and so on). The API never returns stored channel settings, so the edit form starts empty, and saving replaces the stored settings with whatever is in the form.
Channel settings are encrypted at rest and never returned by the API. Sending is best effort: failures are logged and never block polling.
Open Settings → Backup & Restore.
-
Download Backup saves
switchdeck-backup-<timestamp>.json. It contains:- all switches, with their passwords in plaintext
- custom port names
- login settings (
auth_enabled, username and password hash) - API tokens (as hashes, so existing tokens keep working after a restore)
- notification channels, with their credentials in plaintext
It does not contain the server's encryption key, the session secret or collected switch data. Store the file securely.
-
Restore uploads a backup file. It deletes all existing switches, port names, API tokens and notification channels, then imports the file. Login settings from the file overwrite the current ones. Credentials are re-encrypted with the target server's key, so backups move between servers.
Restore through the API:
curl -X POST http://localhost:8080/api/v1/backup/restore \
  -H "Authorization: Bearer <token>" \
  -F "file=@switchdeck-backup-2026-05-31T120000Z.json"
The request can also send the JSON as the raw request body. The limit is 8 MB.
Note
Restore writes to the database but does not restart the polling workers. Restart SwitchDeck after a restore so that the restored switches are polled.
GET /metrics is always public. Add it to your Prometheus scrape_configs:
scrape_configs:
  - job_name: switchdeck
    static_configs:
      - targets: ["localhost:8080"]
Metrics come from the in-memory worker cache, so a scrape never logs in to a switch. Only enabled switches are exported.
All metric names start with switchdeck_. Switch-level metrics carry switch_id and switch_name labels; port-level metrics add port.
| Metric | Type | Labels / notes |
|---|---|---|
switch_info |
Gauge (always 1) | + ip, model, firmware, hardware |
scrape_success |
Gauge | 1 if the worker has a cached snapshot |
switch_up |
Gauge | 1 if the worker has a cached snapshot (it does not follow the 30 s TCP probe) |
switch_collecting |
Gauge | 1 while a collection is running |
switch_ports_total / switch_ports_up / switch_ports_down |
Gauge | Port link summary |
switch_last_collected_timestamp_seconds |
Gauge | Unix time of the last full collection |
port_info |
Gauge (always 1) | + port_name (custom name or Port N) |
port_up / port_enabled / port_speed_mbps |
Gauge | Link state, admin state, negotiated speed |
port_rx_packets_total / port_tx_packets_total |
Counter | Good packets |
port_rx_errors_total / port_tx_errors_total |
Counter | Bad packets |
port_rx_bytes_total / port_tx_bytes_total / port_rx_dropped_total / port_tx_dropped_total |
Counter | Always 0 on the TL-SG108E, which reports packet counts only |
igmp_enabled / igmp_groups_total |
Gauge | IGMP snooping |
qos_port_priority |
Gauge | 1 (lowest) to 4 (highest) |
bandwidth_ingress_kbps / bandwidth_egress_kbps |
Gauge | Rate limits, 0 = unlimited |
storm_broadcast_kbps / storm_multicast_kbps / storm_unknown_unicast_kbps |
Gauge | Storm thresholds, 0 = disabled |
loop_prevention_enabled / vlan_count / lag_count |
Gauge | Misc switch config |
mac_table_entries_total / lldp_neighbors_total |
Gauge | Always 0: not collected from the switch |
poe_budget_watts / poe_consumed_watts / poe_port_enabled / poe_port_watts |
Gauge | Defined, but not exported by the current TP-Link client |
stp_enabled / stp_port_state |
Gauge | Defined, but not exported by the current TP-Link client (state: forwarding=5, learning=4, listening=3, blocking=2, disabled=1) |
grafana/switchdeck-dashboard.json is a dashboard for Grafana 10+ (uid switchdeck-overview). Import it through Dashboards → New → Import and select your Prometheus data source.
- Variables:
datasource(Prometheus) andswitch(values ofswitch_namefromswitchdeck_switch_up). - Rows: Switch Overview (status, ports up/down/total, scrape success, last collected), Port Status (table plus up/down over time), Traffic (bytes/s and packets/s), Errors & Drops, PoE, Network Features (STP, IGMP, loop prevention, VLANs, LAGs, MAC table, LLDP, IGMP groups), Bandwidth & Storm Control, and QoS.
On a TL-SG108E the bytes, drops, PoE, STP, MAC table and LLDP panels stay empty or at 0 (see above).
The REST API is under /api/v1 and uses JSON. When authentication is enabled, send either the session cookie from POST /api/v1/auth/login or an Authorization: Bearer <token> header. Without it the API returns 401 {"error":"unauthorized"}.
There is no OpenAPI/Swagger document; the tables below come from the router in internal/server/server.go.
| Method | Path | Description |
|---|---|---|
POST |
/api/v1/auth/login |
Body {"username","password"}; sets the session cookie |
POST |
/api/v1/auth/logout |
Clears the session cookie |
GET |
/api/v1/auth/session |
Returns auth_enabled and authenticated |
| Method | Path | Description |
|---|---|---|
GET |
/api/v1/switches |
List switches with status, model, port counts and per-port states |
POST |
/api/v1/switches |
Add a switch: name, ip, username, password (required), insecure_tls, poll_stats_secs, poll_config_secs |
GET |
/api/v1/switches/{id} |
Get one switch (the password is never returned) |
PUT |
/api/v1/switches/{id} |
Replace the switch configuration (same fields as POST, plus enabled) |
DELETE |
/api/v1/switches/{id} |
Remove a switch |
POST |
/api/v1/switches/{id}/collect |
Start an immediate full collection (returns 202) |
GET |
/api/v1/switches/{id}/snapshot |
Full cached snapshot |
GET |
/api/v1/switches/{id}/ports |
Ports |
GET |
/api/v1/switches/{id}/stats |
Port statistics |
GET |
/api/v1/switches/{id}/vlans |
VLANs |
GET |
/api/v1/switches/{id}/lag |
LAG groups |
GET |
/api/v1/switches/{id}/port-names |
Custom port names ({"<port>": "<name>"}) |
PUT |
/api/v1/switches/{id}/port-names/{port} |
Body {"name": "Uplink"}; an empty name removes it |
These change the live switch configuration. A wrong value can take ports, VLANs or the whole switch offline.
| Method | Path | Body |
|---|---|---|
PATCH |
/api/v1/switches/{id}/ports/{port} |
Any of enabled (bool), speed, flow_control (bool); ports 1–8 only. speed accepts "10M", "100M" or "1G" (10M and 100M are set as full duplex); any other value sets Auto. |
POST |
/api/v1/switches/{id}/stats/reset |
— (clears all port counters) |
PATCH |
/api/v1/switches/{id}/vlans |
Array of {"id", "name", "port_members": {"<port>": "tagged" | "untagged" | "excluded"}} (replaces the 802.1Q VLAN setup). Also switches the device into 802.1Q VLAN mode. |
PATCH |
/api/v1/switches/{id}/lag |
Array of {"id", "name", "ports": [...]} (static trunks). name is ignored; id 2 maps to trunk group 2 and any other id to group 1. |
PATCH |
/api/v1/switches/{id}/mirror |
{"enabled", "dest_port", "mode": "both" | "ingress" | "egress", "source_ports": [...]} |
PATCH |
/api/v1/switches/{id}/qos |
{"mode": "port" | "802.1p" | "dscp", "ports": [{"port_number", "priority"}]}. Ports missing from the array are reset to priority 1. |
PATCH |
/api/v1/switches/{id}/storm-control |
Array of {"port_number", "broadcast_kbps", "multicast_kbps", "unknown_unicast_kbps"}. Ports missing from the array are reset to 0 (disabled). |
PATCH |
/api/v1/switches/{id}/igmp |
{"enabled": true}. Also turns report suppression off. |
PATCH |
/api/v1/switches/{id}/loop-prevention |
{"enabled": true} |
POST |
/api/v1/switches/{id}/reboot |
— (the switch is unreachable for about 30 s) |
The TL-SG108E often closes the connection after a write without sending a response. For POST-based writes (VLAN, LAG, mirror, QoS, storm control and reboot), SwitchDeck treats a reset connection as success. GET-based writes (port changes, stats reset, IGMP and loop prevention) treat a reset connection as a failure. A port change is re-read from the switch and returned; other writes are confirmed on the next collection.
| Method | Path | Description |
|---|---|---|
GET |
/api/v1/settings |
auth_enabled, username_set |
PUT |
/api/v1/settings |
Any of auth_enabled; username + password together (password ≥ 8 characters) |
GET |
/api/v1/settings/tokens |
List tokens (no secrets) |
POST |
/api/v1/settings/tokens |
Body {"name", "expiry"} (Unix time, 0 = never); returns the plaintext token once |
DELETE |
/api/v1/settings/tokens/{id} |
Revoke a token |
| Method | Path | Description |
|---|---|---|
GET |
/api/v1/notifications |
List channels (settings are not returned) |
POST |
/api/v1/notifications |
Body {"name", "provider", "config", "enabled", "notify_offline", "notify_online"}; provider is shoutrrr, greenapi or whatsapp_web; config is a JSON string with the provider settings |
PUT |
/api/v1/notifications/{id} |
Update a channel; an empty config keeps the stored settings (the UI never sends an empty config) |
DELETE |
/api/v1/notifications/{id} |
Remove a channel |
POST |
/api/v1/notifications/test |
Body {"provider", "config"}; sends a test message |
| Method | Path | Description |
|---|---|---|
GET |
/api/v1/backup |
Download a full backup as JSON |
POST |
/api/v1/backup/restore |
Restore from a backup (multipart/form-data field file, or the raw JSON body) |
| Method | Path | Description |
|---|---|---|
GET |
/metrics |
Prometheus metrics |
GET |
/health |
{"status":"ok"} |
- Switch credentials travel in cleartext. The Easy Smart web interface is plain HTTP, and SwitchDeck always logs in over
http://. Anyone who can capture traffic between SwitchDeck and a switch can read the switch password. Keep the switch management network trusted. - Credentials at rest: switch passwords and notification settings are encrypted with AES-256-GCM. The 32-byte key is generated on first run and stored (base64) in the same SQLite database. This protects against casual disclosure, not against someone who has the whole database file. Protect the data directory and its backups.
- Backup files contain plaintext passwords for every switch and notification channel.
- App authentication is off by default. Turn it on before anyone else can reach SwitchDeck. SwitchDeck serves plain HTTP, and the session cookie has no
Secureflag, so use a TLS reverse proxy if you access it over an untrusted network. There is no rate limit on login attempts. /metricsis public and shows switch names, IPs, models and firmware versions.- Don't expose SwitchDeck to the internet. It controls network hardware.
- Write actions can disrupt your network: disabling the uplink port, changing VLANs or LAGs, mirroring or rebooting can lock you out of the switch. Test changes on a port you can reach physically.
- Switch shows Offline: SwitchDeck checks reachability with a TCP connection to port 80 every 30 s, and marks the switch offline after two failures in a row. Check that the switch web UI is reachable from the SwitchDeck host (with Docker, from inside the container network).
- "authentication failed: wrong username or password" in the logs: the switch rejected the credentials. Edit the switch and enter the password again.
- Data looks stale after a switch reboot or credential change: each worker logs in once, when it starts. Collect does a one-off refresh with a new session; to restart the worker itself, edit and save the switch (re-enter the password) or restart SwitchDeck.
- Byte counters are 0: the TL-SG108E reports only good and bad packet counts.
- Restored switches are not polled: restart SwitchDeck after a restore.
- Locked out of the UI: run
--reset-passwordagainst the same data directory.
go test ./...                 # unit tests (switch HTML is parsed from fixtures in test/testdata)
go vet ./...
./scripts/dev.sh              # go run with --port ${PORT:-8080} --log-level ${LOG_LEVEL:-debug}
VERSION=dev ./scripts/build.sh   # cross-compile into dist/
scripts/dev.sh uses the default data directory /data/switchdeck; pass --data to go run ./cmd/switchdeck directly if you want a local folder.
Project layout:
cmd/switchdeck/            entry point, CLI flags, --reset-password
internal/api/handlers/     REST handlers
internal/api/middleware/   session / bearer-token auth
internal/auth/             argon2id hashing, signed session tokens
internal/backup/           backup export / restore
internal/manager/          per-switch workers, polling, reachability probe
internal/metrics/          Prometheus collector
internal/notification/     channels, senders (Shoutrrr, Green-API, WhatsApp Web)
internal/server/           chi router
internal/store/            SQLite store, AES-256-GCM helpers
internal/switchclient/     switch client interface + TP-Link implementation and parsers
internal/webui/            embedded templates, CSS, JS
grafana/                   Grafana dashboard
scripts/                   build.sh, dev.sh, next-version.sh
Versions follow YYYY.M.PATCH. Release and GHCR publishing are started manually; Docker Build also runs automatically after a successful Release:
- Release (
release.yml): computes the next version withscripts/next-version.sh(or takes one as input), builds all targets withscripts/build.sh, tags the commit and publishes a GitHub Release. - Docker Build (
docker.yml): runs after a successful Release, or manually. It buildslinux/amd64,linux/arm64andlinux/arm/v7images and pushestechblog/switchdeck:latestandtechblog/switchdeck:<latest tag>. - Publish to GHCR (
publish-ghcr.yml): manual build and push toghcr.io/t0mer/switchdeck. It has not been run yet, so no GHCR image exists.
Issues and pull requests are welcome. Please run go test ./... and go vet ./... before you open a pull request. Support for more switch models needs sanitized page fixtures (see test/testdata/). Remove real IPs, MACs and credentials first.