This is a Simple and Realtime JavaScript chart that does not depend on libraries such as jQuery or google APIs.
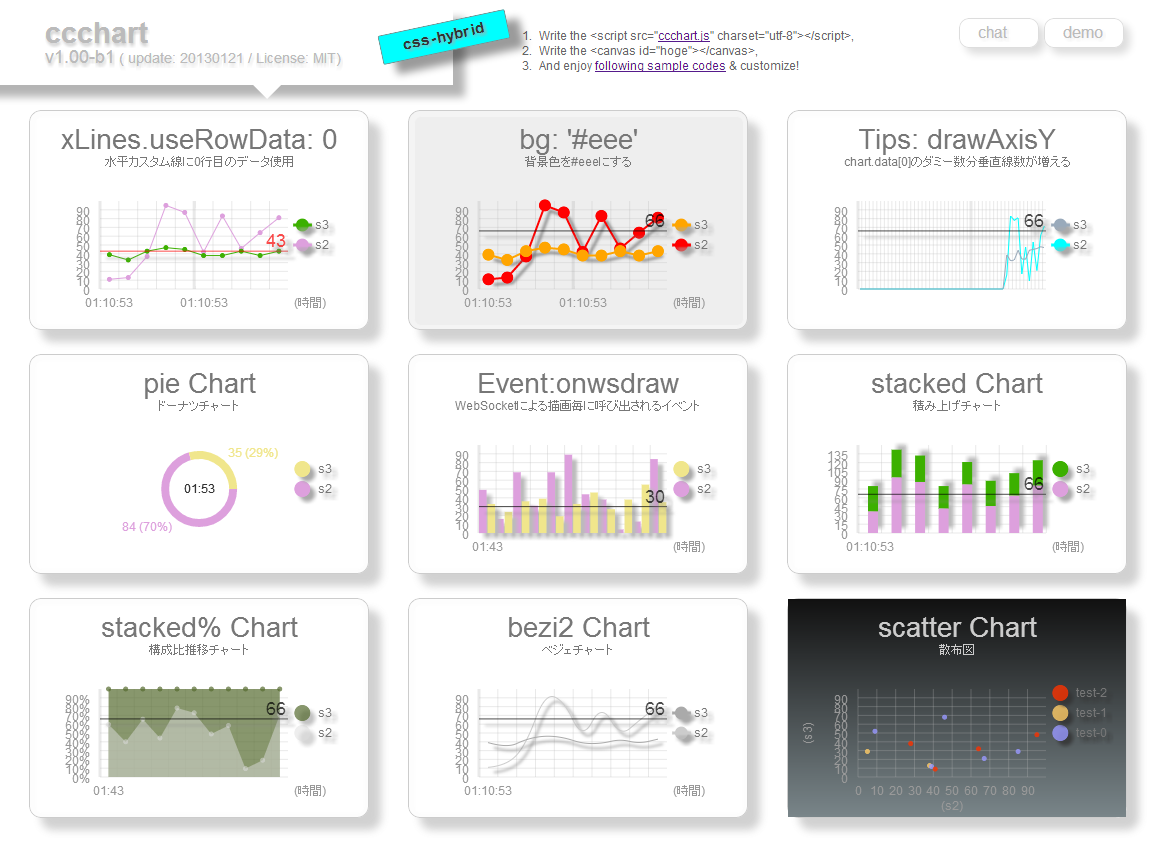
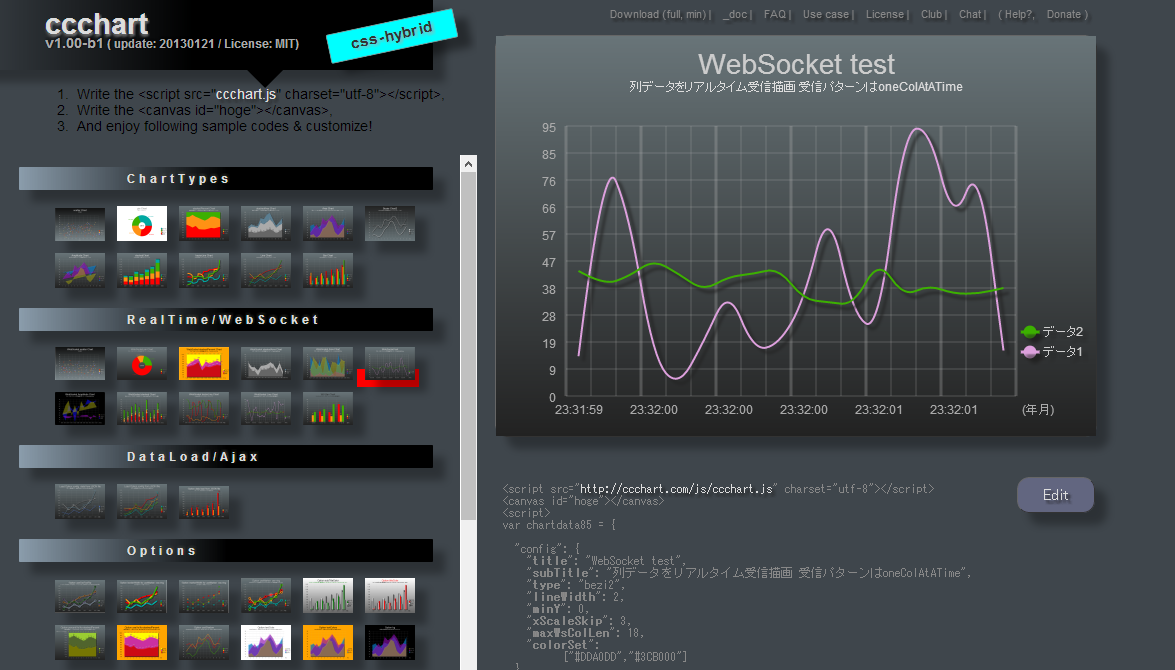
@see http://ccchart.com/ @see http://ccchart.com/test/ws2.htm @doc (old) http://ccchart.com/doc/ccchart-1.06.3.pdf @blog http://ngw.jp/~tato/wp/?tag=ccchart @chat http://cht.pw/chat.htm
http://jsfiddle.net/UkdvS/451/
<script src="http://ccchart.com/js/ccchart.js" charset="utf-8"></script>
<canvas id="hoge"></canvas>
<script>
var chartdata1 = {
  "config": {
    "title": "Option useMarker",
    "subTitle": "useMarker: maru",
    "type": "line",
    "useMarker": "maru",
    "lineWidth": 6,
    "markerWidth": 15
  },
  "data": [
    ["Year",2007,2008,2009,2010,2011,2012,2013],
    ["Tea",435,332,524,688,774,825,999],
    ["Coffee",600,335,584,333,457,788,900],
    ["Juice",60,435,456,352,567,678,1260],
    ["Oolong",200,123,312,200,402,300,512]
  ]
};
ccchart.init('hoge', chartdata1)
</script>
http://ccchart.com/#85
Client Side
<script src="http://ccchart.com/js/ccchart.js" charset="utf-8"></script>
<canvas id="hoge"></canvas>
<script>
var chartdata1 = {
  "config": {
    "title": "WebSocket test",
    "subTitle": "realtime chart",
    "type": "bezi2",
    "lineWidth": 2,
    "minY": 0,
    "xScaleSkip": 3,
    "maxWsColLen": 18,
    "colorSet":
          ["#DDA0DD","#3CB000"]
  },
  "data": [
    ["time"],
    ["data1"],
    ["data2"]
  ]
};
  ccchart
      .init('hoge', chartdata1)
      .ws('ws://ccchart.com:8016')
      .on('message', ccchart.wscase.oneColAtATime)
</script>
var WsServer = require('ws').Server;
var tid;
var ws = new WsServer({
host: 'ccchart.com',
port: 8016
});
//start
broadCast();
function broadCast() {
tid = setInterval(function() {
var dataAry = mkData();
ws.clients.forEach(function(client) {
if (client.readyState === 1)
client.send(JSON.stringify(dataAry));
});
}, 200);
}
function mkData() {
var data = [
["Year"],
["s2"],
["s3"]
];
var now = new Date();
var H = now.getHours();
var M = now.getMinutes();
var S = now.getSeconds();
H = (H < 10) ? '0' + H : H;
M = (M < 10) ? '0' + M : M;
S = (S < 10) ? '0' + S : S;
data[0] = H + ':' + M + ':' + S;
data[1] = Math.floor(Math.random(10) * 96);
data[2] = 32 + Math.floor(Math.random(10) * 18);

return data;

}
//on connection for Heartbeat これはハートビート用なのでいらなければ無くてもOK
// ccchart はデフォルトでは60秒に一度"Heartbeat"という文字列を
// サーバーへ送り、その返信である"Heartbeat"文字列を受信しています
ws.on('connection', function(socket) {
console.log(
    'conned: ' + ws.clients.length, (new Date),
    socket.upgradeReq.socket.remoteAddress
);

socket.on('message', function(msg) {
    var msg = JSON.stringify(msg);
    if (msg === 'Heartbeat') {
        if (socket.readyState === 1) {
            socket.send(msg);
            console.log(msg);
        }
    }
});

});
- [ WebSocket func ] blog | ccchart.wscase.plain
- [ Pointer ] blog | ccchart.crossPointer(op)
- [ Drop & Drow ] blog | ccchart.dropDraw()
- [ showcase ] さまざまなチャート
- [ base Method ] グローバル config のデフォルト値設定
- [ add Method ] 2つのチャートを複合させる.add, .after, .before [new]
- [ data ] チャートデータの列と行を交換する
- [ data ] データがしきい値に達したら何か実行する [new]
- [ value ] 値表示とパーセント表示
- [ value ] percentValを使わずにパーセント表示
- [ img ] 複数画像の埋め込みと透明化
- [ Tooltip ] ツールチップの CSS カスタマイズ
- [ Tooltip ] ツールチップのためのテンプレート記法
- [ Tooltip ] Bar チャート用のツールチップ
- [ Tooltip ] ツールチップ on the リアルタイム
- [ WebSocket ] WebSocketの受信サンプル
- [ WebSocket ] ccchartへサーバー側WebSocketから流し込む
- [ WebSocket ] WebSocketで受信するデータパターン関数
- [ WebSocket ] 受信パターン関数名を取得する
- [ WebSocket ] 着信データを間引く
- [ WebSocket ] id名/最新wsOjのkey/value
- [ WebSocket ] ws接続のインスタンスをidで取得
- [ WebSocket Debug ] WebSocket使用時のデバック用プロパティ
- [ DragDrop ] ファイルドロップでチャート表示
- [ Scale ] 軸目盛値の端数処理(丸め)の桁数を指定する
- [ Scale ] 軸目盛値の端数処理(丸め)の桁数を指定する
- [ Scale ] 水平目盛り線の本数を指定する axisXLen
- [ Scale ] 水平軸目盛の傾き xScaleRotate
- [ Scale ] 水平目盛り線の幅 axisXWidth [new]
- [ Scale ] 垂直目盛り線の幅 axisYWidth [new]
- [ Scale ] 垂直スキップ線の幅 axisYSkipWidth [new]
- [ Scale ] 垂直軸目盛値にパーセント yScalePercent [new]
- [ Scale ] 凡例を使わない useHanrei
- [ Scale ] Y軸0基準線の上下にチャート表示 line, bar, bezi2, bezi
- [ Scale ] Y軸目盛の天地を反転する yScaleOrder
- [ xLine ] カスタムXラインの上下を塗る fillOver, fillUnder [new]
- [ Hanrei ] hanreiAlignを設定する
- [ Hanrei ] 凡例1行の高さを設定する hanreiLineHeight
- [ Data ] データの1列目目を各行の項目名とする
- [ Data ] データの1行目を項目名とする
- [ Pie ] 値の位置オフセットを調整する
- [ CSV ] CSVを読み込んでテーブルとチャートを表示する
- [ CSV ] 読み込むCSVに3桁カンマが含まれててもOK
MIT