Support importing Instruments profiles#2138
Conversation
 canova
left a comment
canova
left a comment
There was a problem hiding this comment.
Just skimmed the code a bit, so this is not a review but wanted to post the things I saw as an early feedback.
Overall, I think we could use lots of comments, especially comments on top of functions that explains the behavior of it.
d2aa38e to
99e0da5
Compare
Codecov Report❌ Patch coverage is Additional details and impacted files@@ Coverage Diff @@
## main #2138 +/- ##
=======================================
Coverage ? 85.77%
=======================================
Files ? 204
Lines ? 14602
Branches ? 3658
=======================================
Hits ? 12525
Misses ? 1899
Partials ? 178 ☔ View full report in Codecov by Sentry. 🚀 New features to boost your workflow:
|
02874e9 to
9e05c2c
Compare
3352143 to
09c4367
Compare
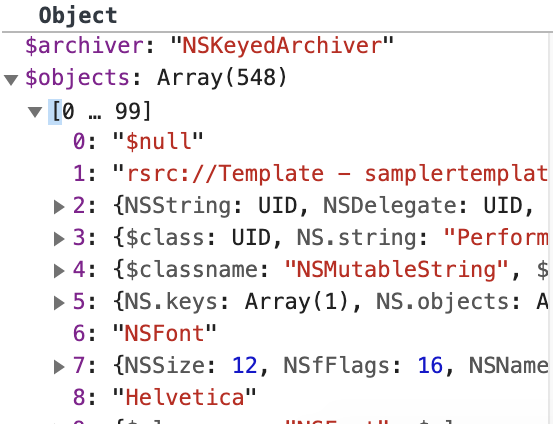
- Implement readFormTemplateFile function to get and read the form.template file
- Implement readInstrumentsArchive (helper function for readFormTemplateFile)
- Implement parseBinaryPlist (helper function for readInstrumentsArchive)
- Implement BinaryPlistParser class to parse the binary plist data
- This function extracts the samples (timestamp, threadID, backtraceID)
This map helps resolving backtraceID field inside each sample tuple
- Add check for not processing same run again
- Extract threadIDToSamples map <threadId, [samples]>
- Fill FuncTable
- Fill FrameTable
- Fill StackTable
- Fill SamplesTable
Update the timestamp
8528195 to
6b02380
Compare
|
Thanks @rajmeghpara, is it ready for another review? |
|
@julienw , There are 8 more comments which are unresolved. I'll try to resolve all of them by this week. Thanks! :) |
|
Thanks for the update! |
|
@julienw, Apple BinaryPlist data format is very unstructured.
So it's hard to define a type for this kind of arrays or objects. That's why I had to put cc: @canova |
|
hey raj, a quick note that we didn't forget you, but we've been super busy lately. I still want to look at this soon... |
|
@julienw, It's completely fine :) |
 julienw
left a comment
julienw
left a comment
There was a problem hiding this comment.
Hey @raj, I'm deeply sorry for the delay to look at this again.
I'm a bit confused because I see that a lot of my comments have been marked as "resolved" but they're not been handled. Maybe you forgot to commit something?
I unresolved the comments where I don't see the fix, and added a bit more detailed code bits for some parts. I think that most of the comments are pretty straightforward, except maybe the tests. Tell me what you think!
Also again please tell me if you'd like that we take it from there. This is a quite big piece of work and we'd understand if you're busy with other thing!
Thanks again for your work!
|
|
||
| let webkitEntry = null; | ||
|
|
||
| if ('webkitGetAsEntry' in firstItem) { |
There was a problem hiding this comment.
If items has a length of 0, firstItem will be undefined, and this if condition will throw an error.
Also items isn't supported in all browsers yet, only chromium- and gecko-based browsers, and in that case the destructuring above will also fail.
Therefore I think it's better to be a bit more defensive here:
    const {
      files,
      items,
    } = event.dataTransfer;
    if (items && items.length > 0) {
      ...
    }
    if (files.length > 0) {
      ...
    }
I know you already rewrote this part several times, but I think this is important. Sorry for going back and forth on this.
| // This function constructs an object from given interpreter class and property list | ||
| // I have taken inspiration for this function from here: | ||
| // https://github.com/jlfwong/speedscope/blob/9edd5ce7ed6aaf9290d57e85f125c648a3b66d1f/import/instruments.ts#L648 | ||
| function patternMatchObjectiveC( |
There was a problem hiding this comment.
can you please write a comment explaining why we have so many any types here?
There was a problem hiding this comment.
I have mentioned the reason for this comment here: #2138 (comment)
I will also add it to the file.
| // This function adds a padding ahead of given string to make its length equal to a given width value | ||
| function zeroPad(s: string, width: number) { | ||
| return new Array(Math.max(width - s.length, 0) + 1).join('0') + s; | ||
| } | ||
|
|
There was a problem hiding this comment.
| errCb(err); | ||
| } | ||
| ) | ||
| .catch(errCb); |
There was a problem hiding this comment.
What I mean is that maybe we want :
.then(
  blob => {
    ...
    cb(blob)
  },
  errCb
);
The difference is that in your code errors thrown by cb are caught by errCb, but in the code I've put above, errCb will be called only if the zip operation fails.
The difference is tiny but I think this is more correct.
| describe('convertInstrumentsProfile function', () => { | ||
| async function importFromTrace(tracePath: string, fileName: string) { | ||
| const zip = await new Promise<any>((resolve, reject) => { | ||
| return fs.readFile(tracePath, (err, data) => { |
There was a problem hiding this comment.
This is what I had in mind:
    const data = fs.readFileSync(tracePath);
    const zip = await JSZip.loadAsync(data);
I think this is less verbose and clearer :-)
| declare module 'pako' { | ||
| declare module.exports: any; | ||
| } |
There was a problem hiding this comment.
Can we please type at least the inflate function?
I think this works:
declare module 'pako' {
  declare type pako$InflateOptions = {|
    +windowBits?: number,
    +raw?: boolean,
    +chunkSize?: number,
    +dictionary?: string | ArrayBuffer | Uint8Array,
  |};
  declare function inflate(buffer: Uint8Array | number[] | string, options?: pako$InflateOptions): Uint8Array;
  declare function inflate(buffer: Uint8Array | number[] | string, options: {| ...pako$InflateOptions, +to: 'string' |}): string;
  declare module.exports: { inflate: typeof inflate };
}
|
@julienw, |
|
Whoa, I just found some actual documentation! It's packaged inside Instruments.app: If you view a profile in Instruments, you can access this documentation by going to: Main Menu -> Instrument -> Instrument Inspector -> Schemas -> time-profile. |
|
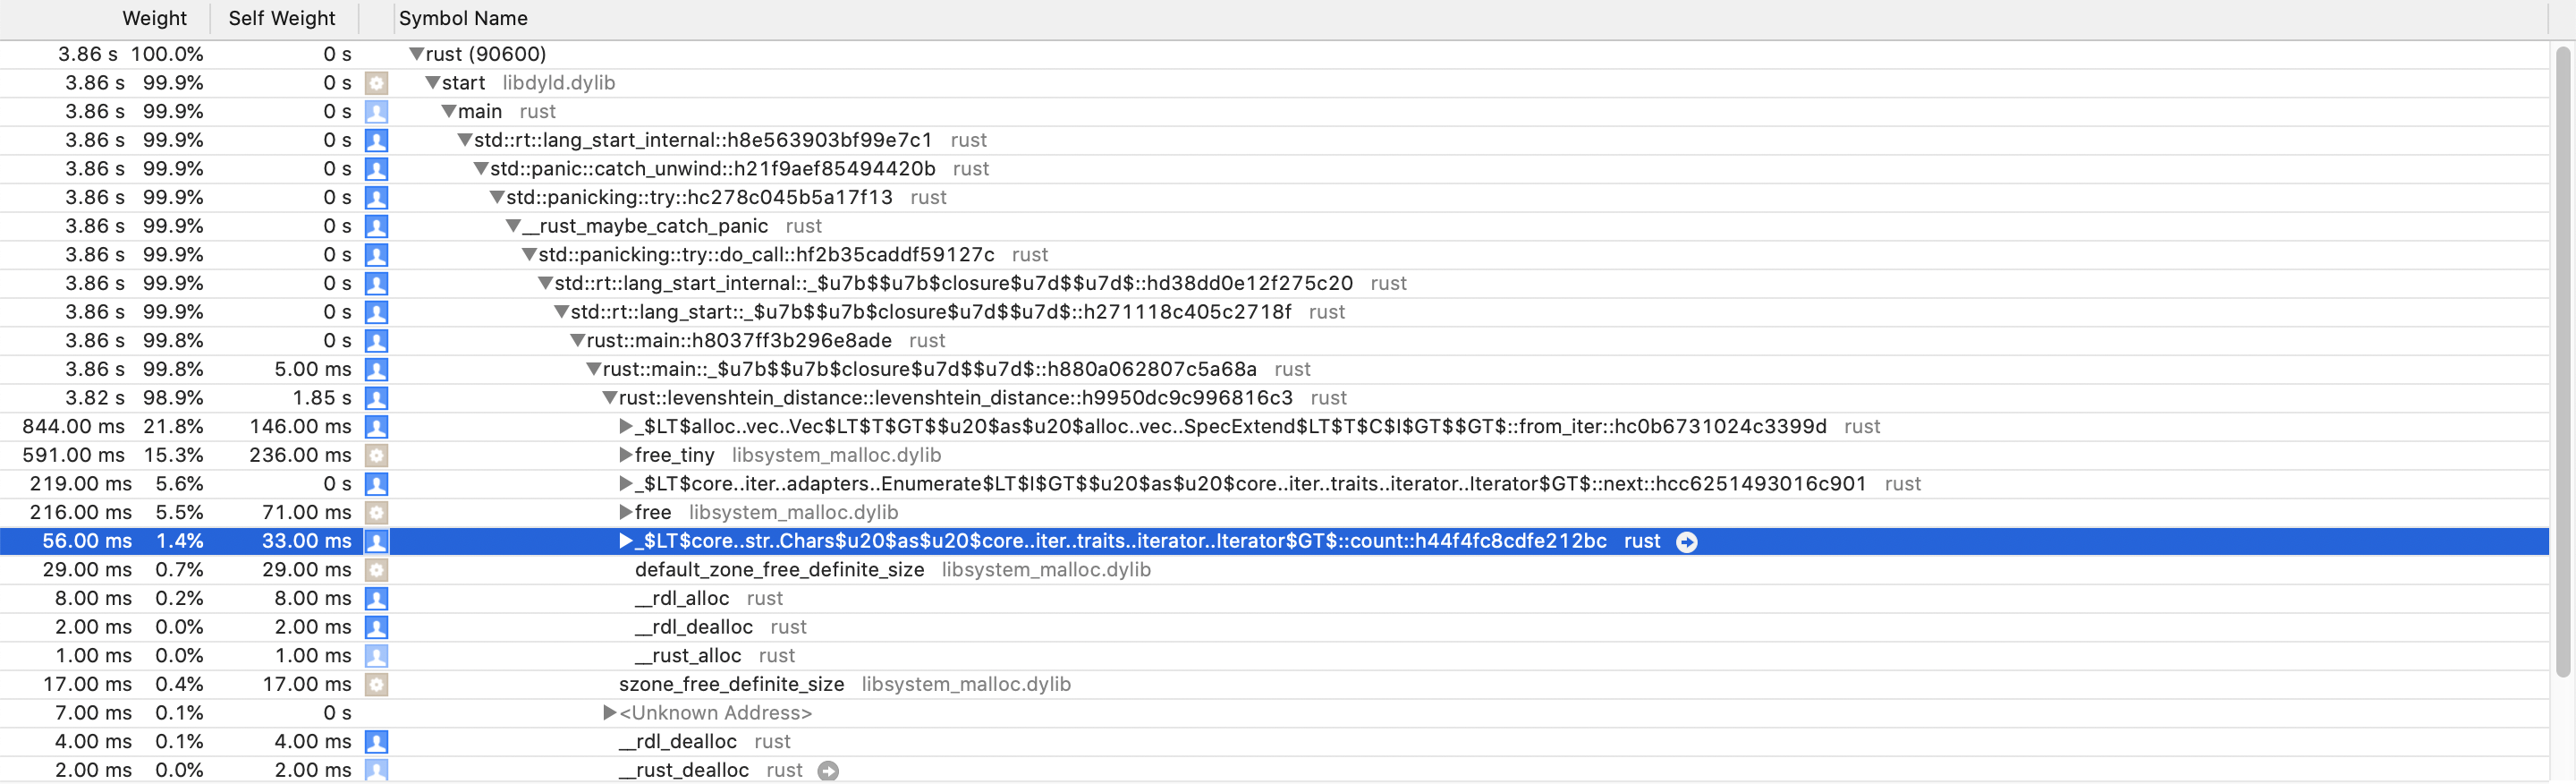
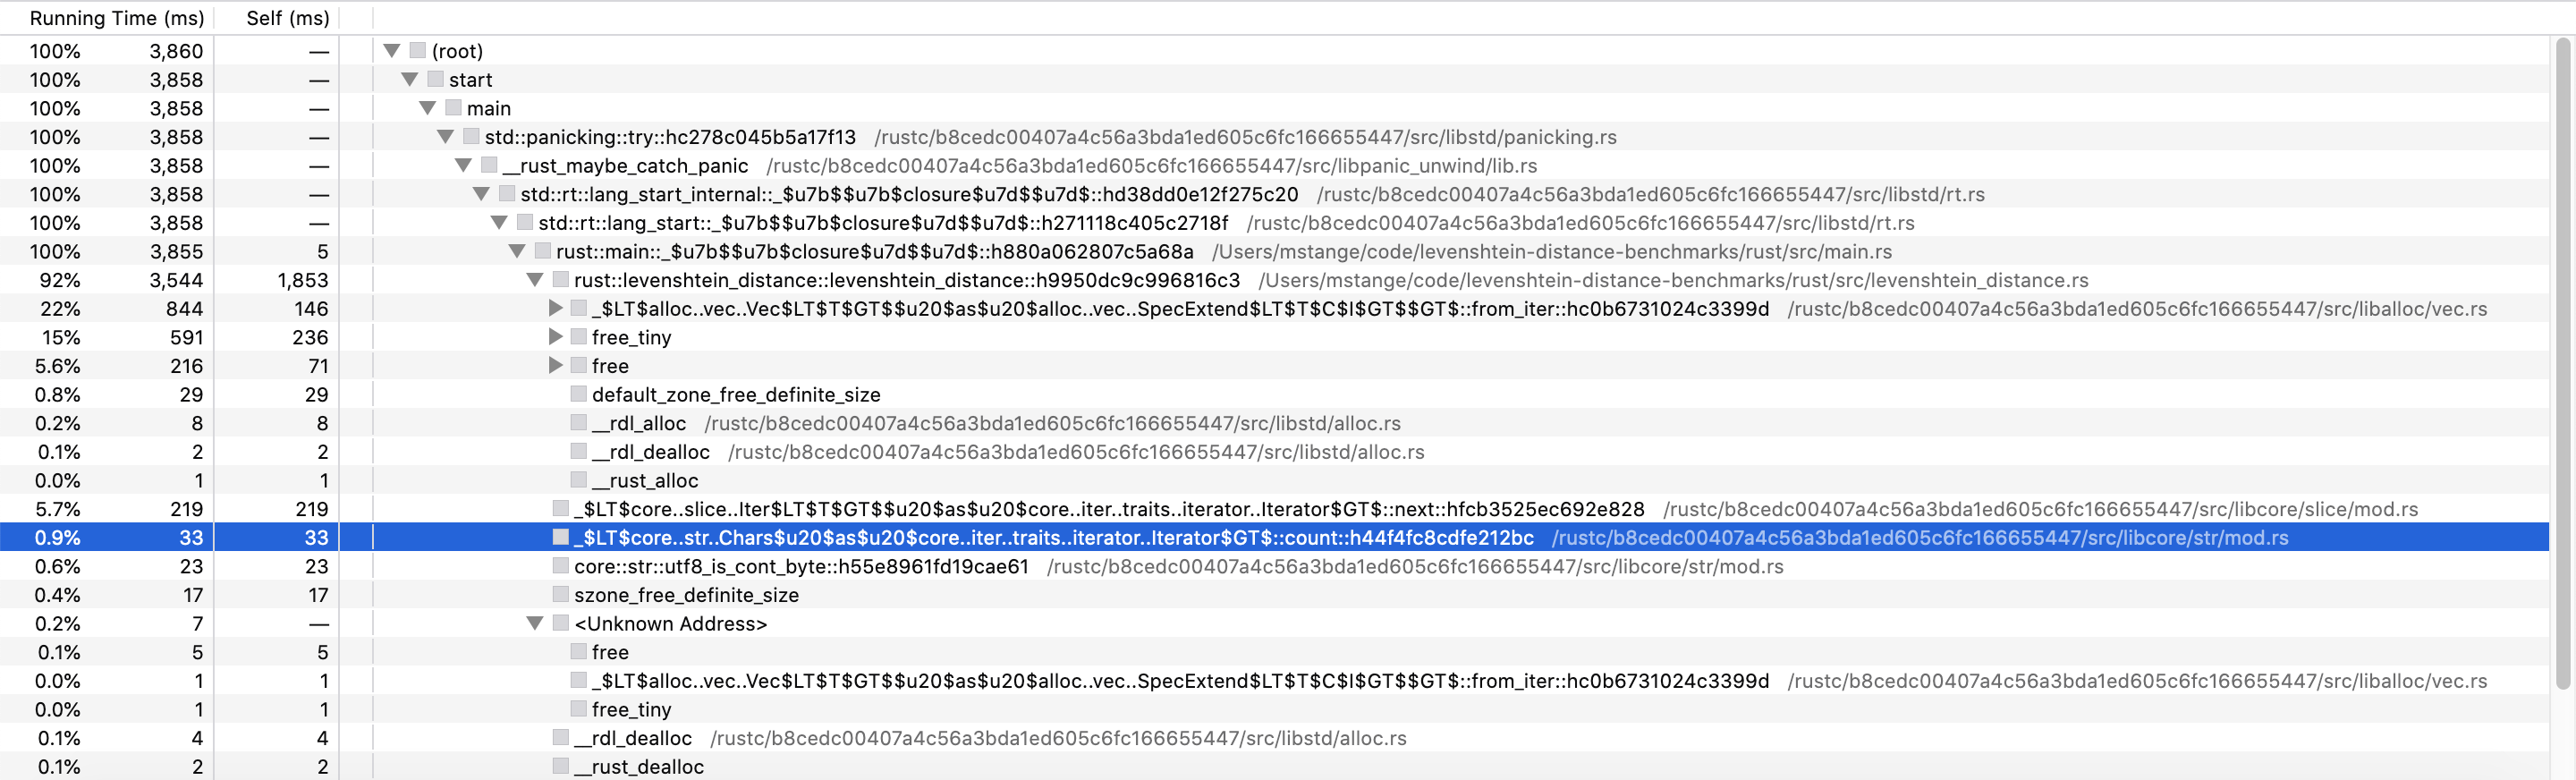
I have a bug report: Inlined frames seem to be assigned to the wrong parent. It seems they're lifted up one level and become a sibling of their actual parent. Instruments (correct): Firefox profiler (incorrect): https://perfht.ml/3aY8qAx In this example, the "count" method ( |
| const backtraceIDtoStack = new Map<number, Array<number>>(); | ||
|
|
||
| function appendRecursive(k: number, stack: Array<number>) { | ||
| const frame = addressToFrameMap.get(k); | ||
| if (frame) { | ||
| stack.push(k); | ||
| return; | ||
| } | ||
|
|
||
| const arrayIndex = k & 0xffffffff; | ||
| if (arrayIndex in arrays) { | ||
| for (const addr of arrays[arrayIndex]) { | ||
| appendRecursive(addr, stack); | ||
| } | ||
| return; | ||
| } |
There was a problem hiding this comment.
Could we get some better names here, and maybe a comment on how this structure works?
So the result is a "backtraceIDToStack" map. In the lambda below, the keys in this map are called "id". And "id" is passed to the "k" argument of appendRecursive. And then k is used as a key to do a lookup in addressToFrameMap. So is k a backtraceID or an address?
And then appendRecursive is both recursive and has a for-of loop in it. It seems like there's a tree structure underlying here, where each backtraceID refers to a list of other backtraceIDs (let's call them children), and appendRecursive traverses the subtree of a given backtraceID in a depth-first search. So the "stack" that's output is really a list of the nodes that were encountered, in traversal order, during this DFS. This is quite unexpected! Is there some intuitive explanation of this graph structure?
|
This implementation also seems to create huge frameTables / funcTables / stringTables. It seems every thread has all the strings for all the threads. And the frameTable.address values seem wrong. |
|
Is it worth keeping this PR open? |
|
Let's close this one. It's been a while, and there was another attempt on instruments importer in #3684. |
#1138
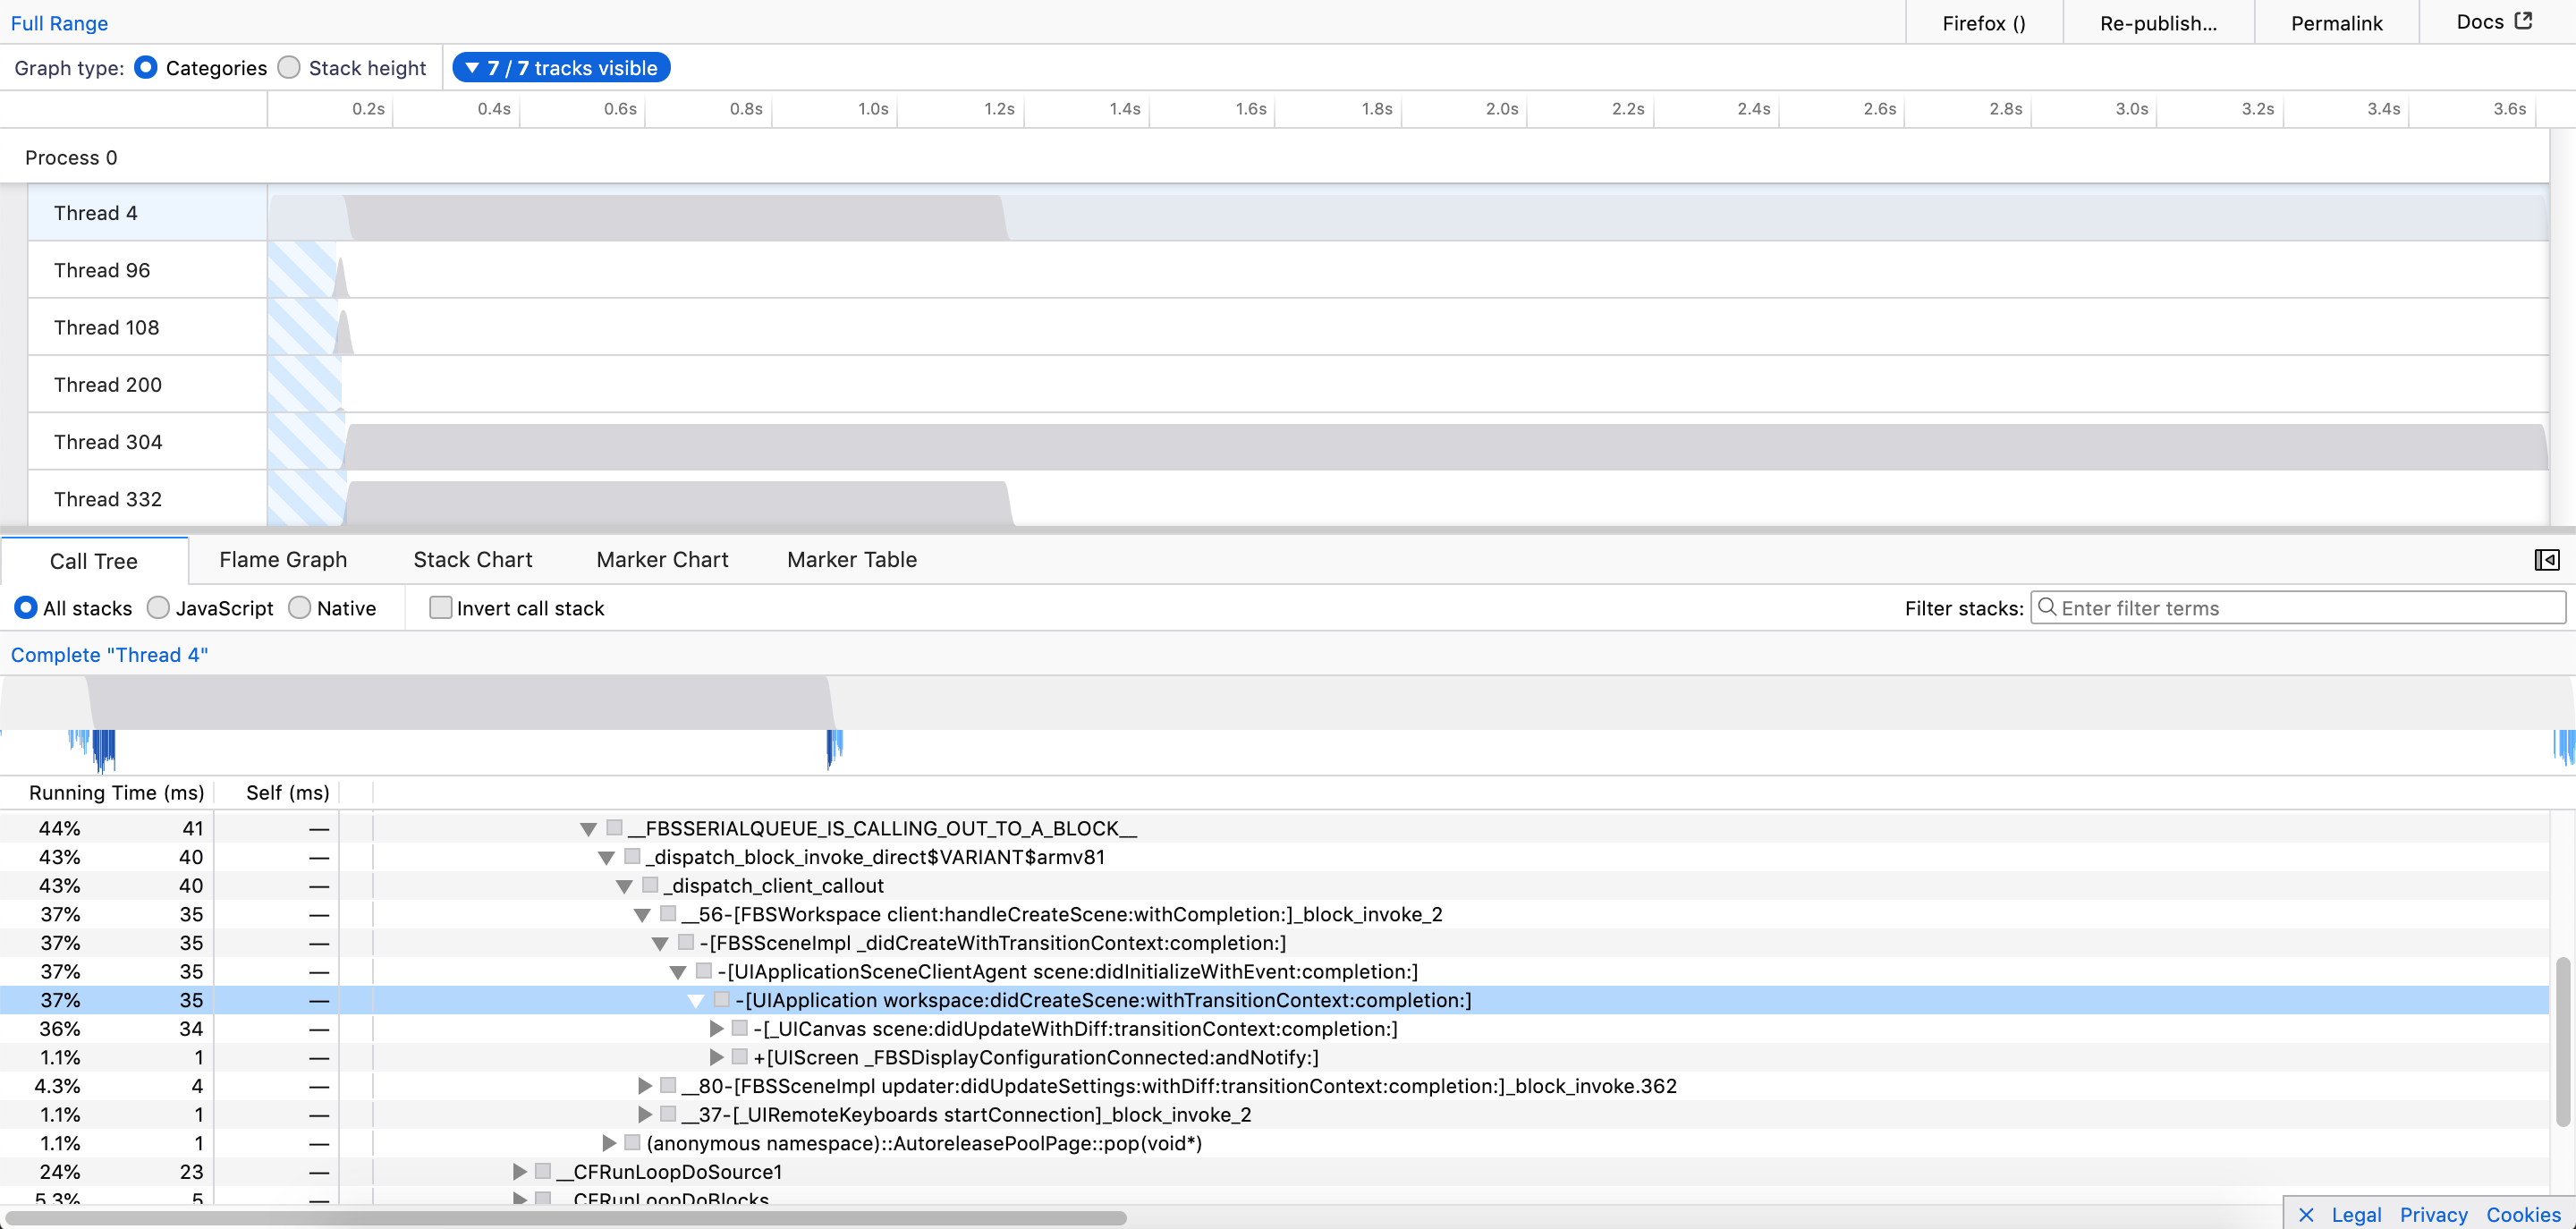
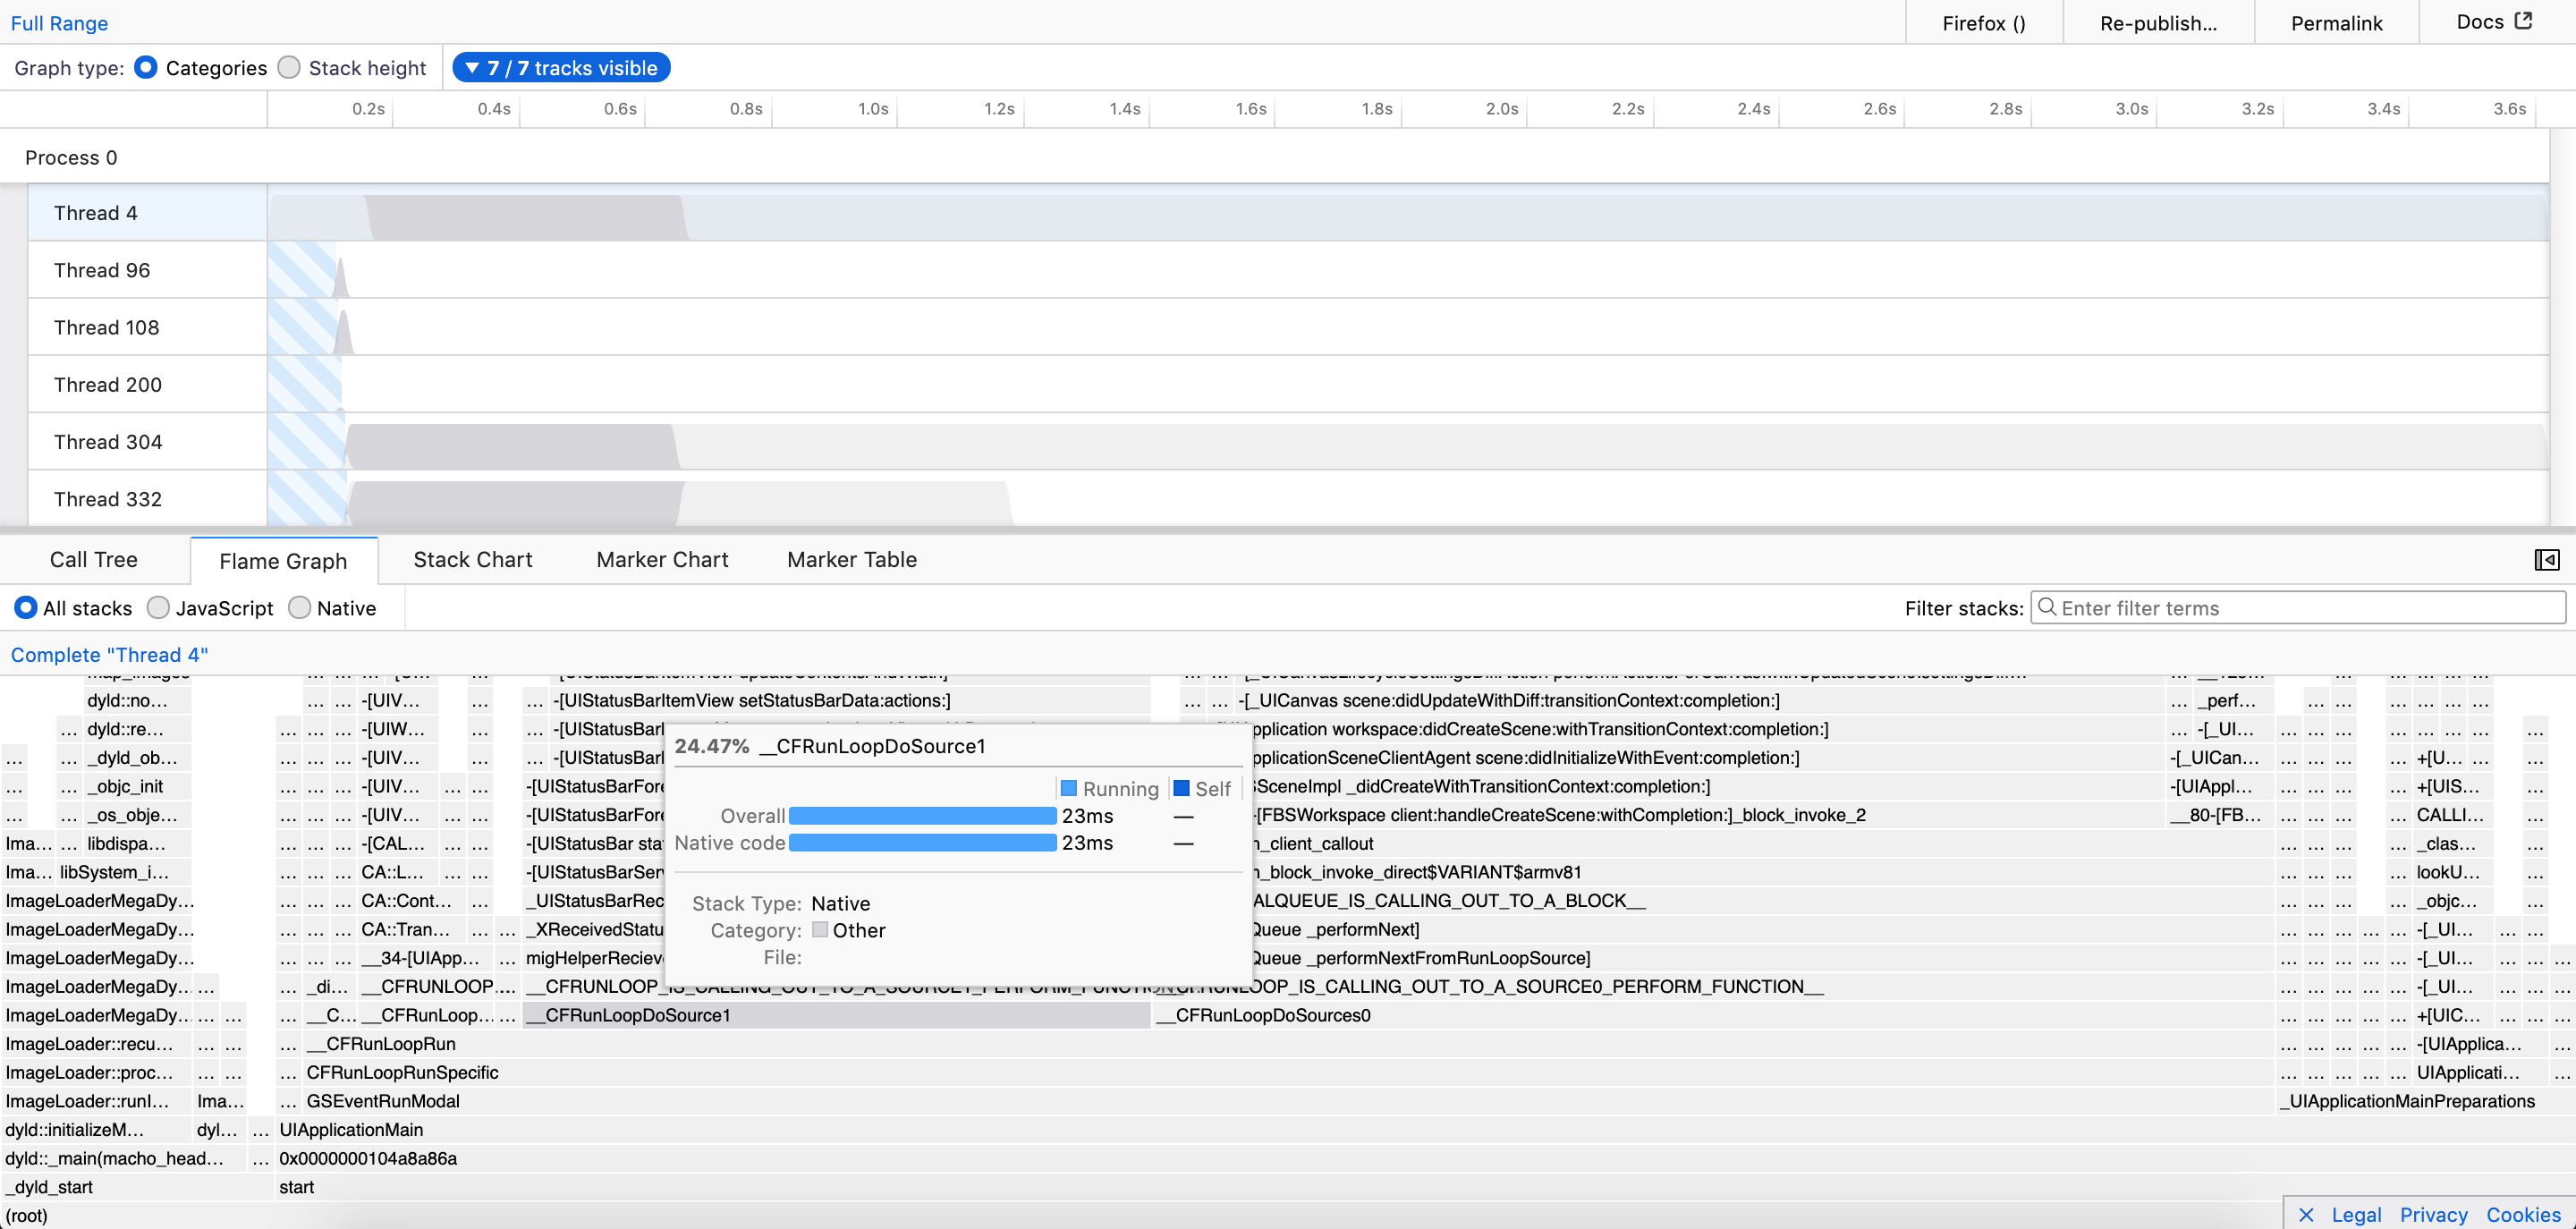
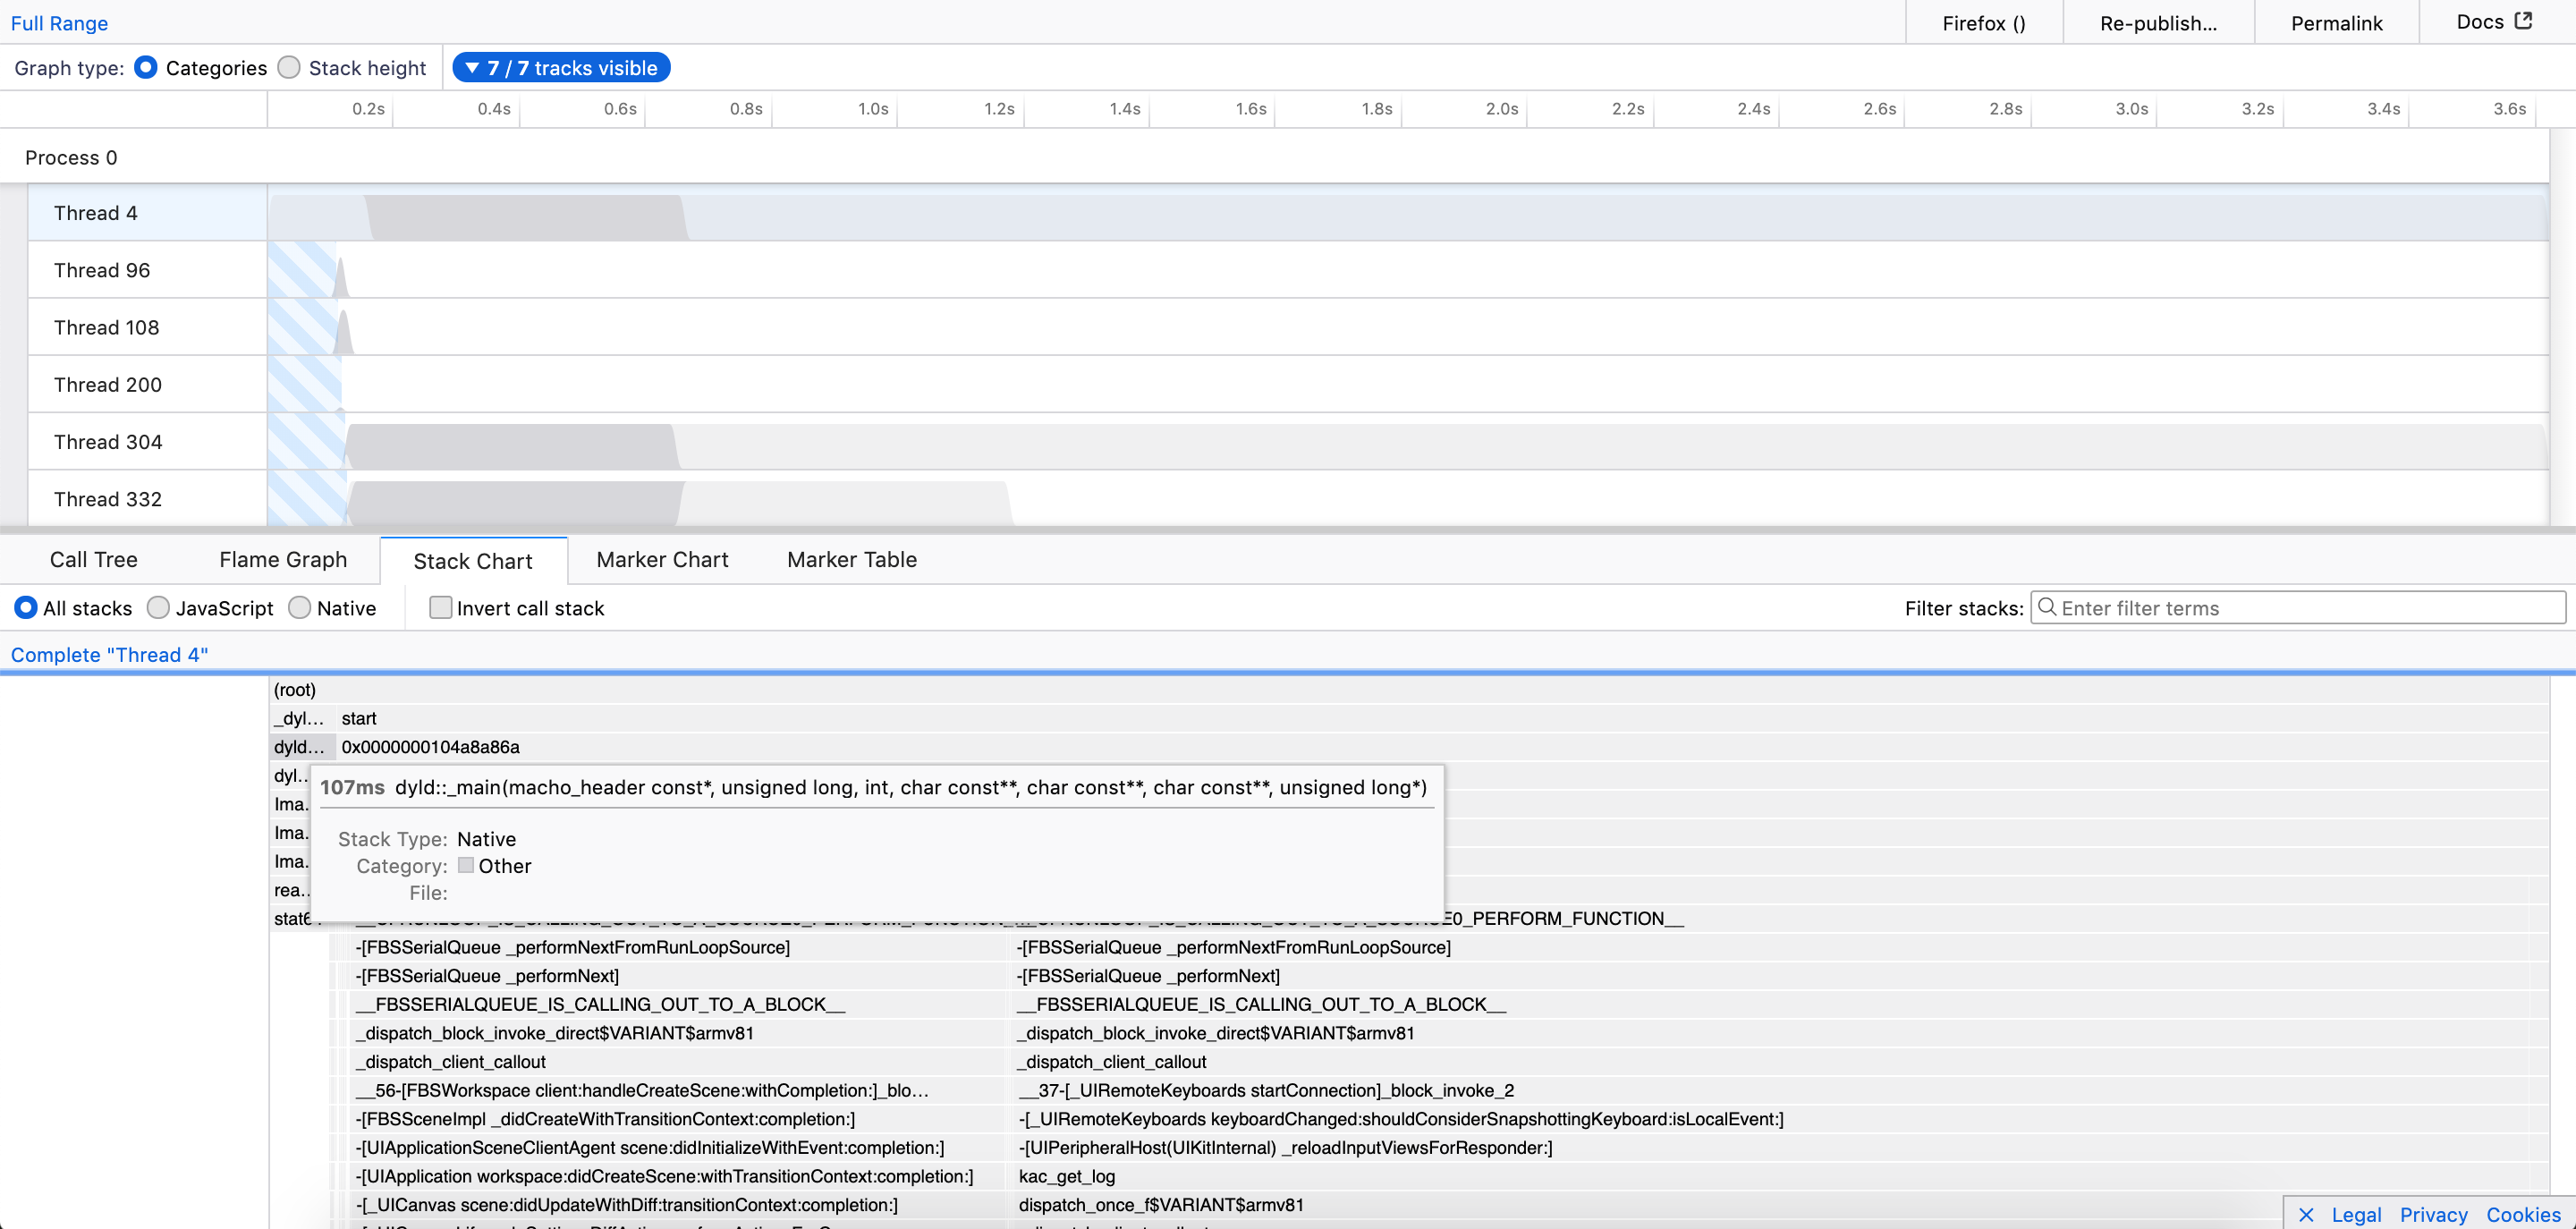
As a part of GSoC’19, this PR makes Firefox Profiler able to process and visualize profiles generated by Instruments Profiler which is a great macOS sampling profiler tool that’s part of Xcode toolset.
This allows users on macOS to use Firefox Profiler for analyzing and visualizing the Instruments profiles.
Example Instruments profile in Firefox Profiler: https://perfht.ml/2OOYDGY
Call Tree:
Flame Graph:
Stack Chart:
┆Issue is synchronized with this Jira Task