Visualize your multicloud cost analytics from Cloud Intelligence™ directly in Grafana. The plugin queries the DoiT API directly, with no data export or sync required, across AWS, Google Cloud, Azure, Oracle Cloud and over 40 additional integrations.
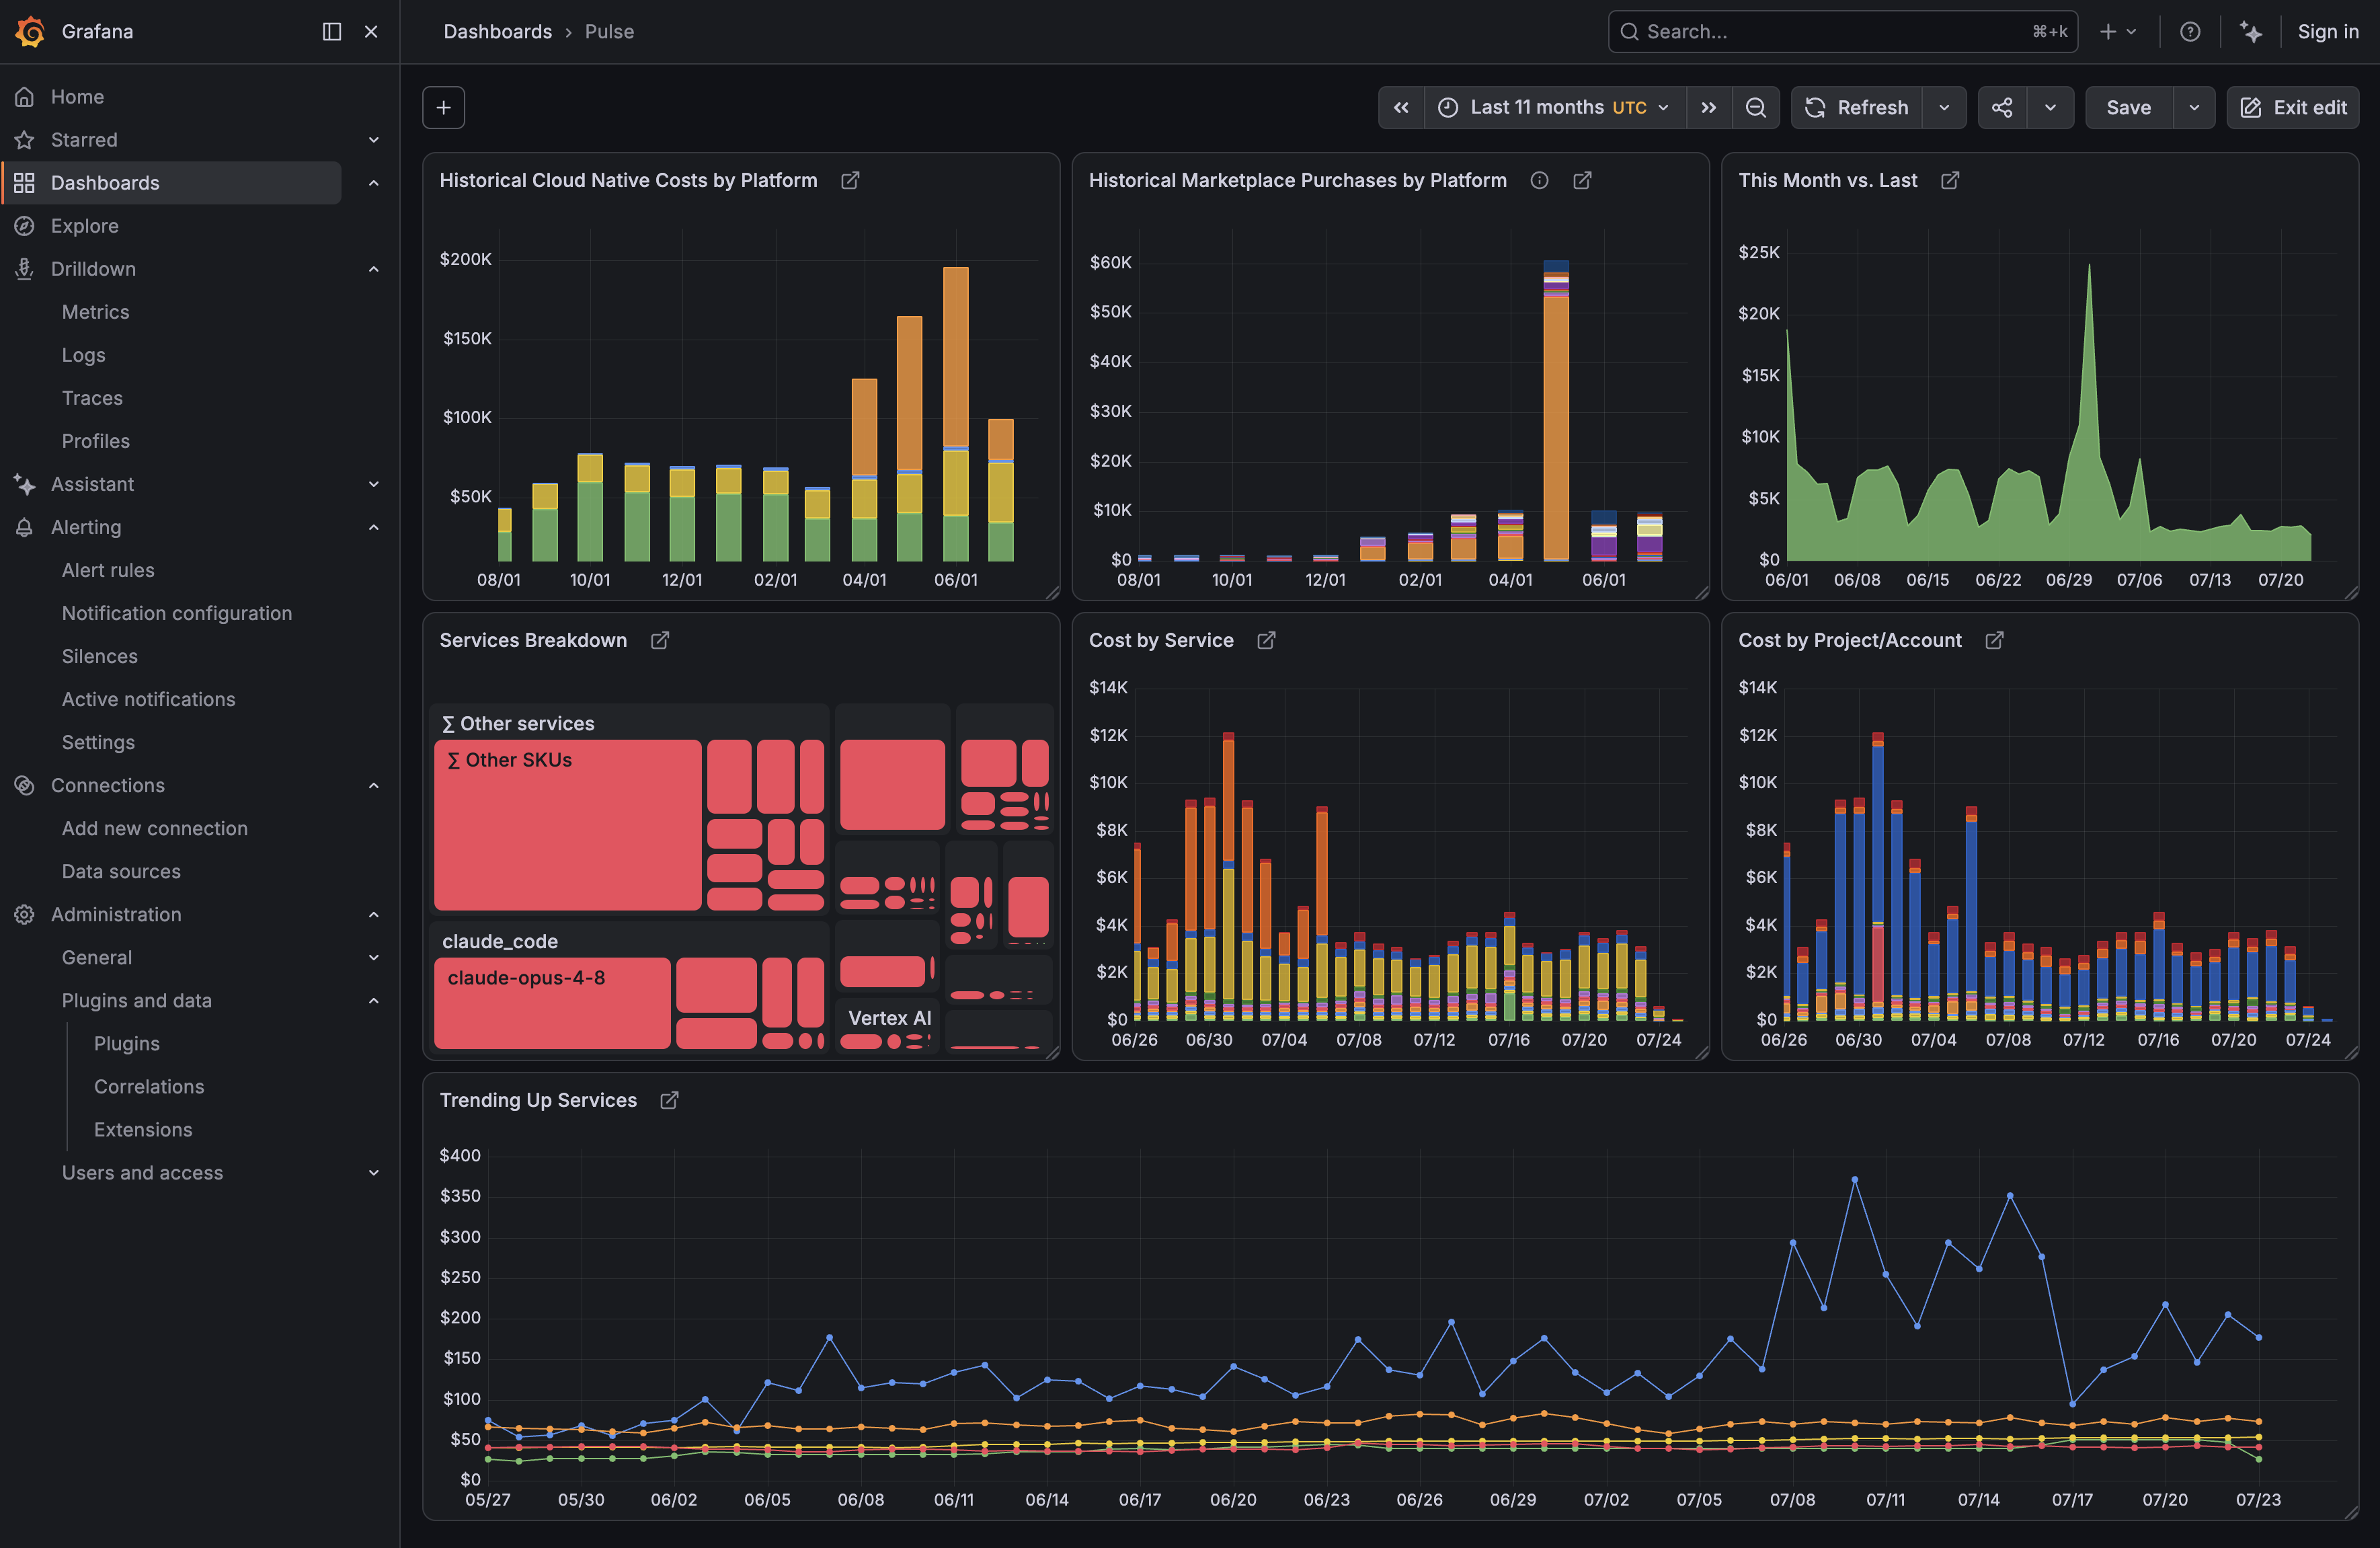
- Saved reports: Run any Cloud Analytics report from your DoiT Console and render its results as Grafana time series, tables, or treemaps.
- Ad-hoc queries: Build cost queries in Grafana — pick a metric (cost, usage, savings), group by dimensions (service, project, SKU, labels, …), and apply filters, without creating a report in the DoiT Console first.
- Grafana time range: Report queries can follow the dashboard time picker instead of the report's own time settings.
- Alerting: The data source supports Grafana Alerting; build alert rules on top of any report or ad-hoc query.
- Dashboard export from DoiT Console: The DoiT Console can generate ready-made Grafana dashboard JSON from any Cloud Analytics dashboard or report for use with this data source.
- Grafana 12.3.0 or later.
- A Cloud Intelligence™ account and a DoiT API key with Cloud Analytics access.
- The Grafana Treemap panel plugin for exported dashboards that contain treemap reports.
-
In Grafana, go to Connections → Data sources → Add new data source and select DoiT Cloud Intelligence.
-
Set the following options:
Option Description API URL DoiT API base URL. Defaults to https://api.doit.com.API Key Your DoiT API key (stored encrypted via Grafana secure JSON data). -
Click Save & test. The health check verifies connectivity and the API key.
To generate an API key, see the DoiT API documentation.
apiVersion: 1

datasources:
  - name: DoiT Cloud Intelligence
    type: doitintl-doitcloudintelligence-datasource
    access: proxy
    jsonData:
      apiUrl: https://api.doit.com
    secureJsonData:
apiKey: $DOIT_API_KEY- Add a panel and choose the DoiT Cloud Intelligence data source.
- Set Query type to Report.
- Select a report from the drop-down (populated from your DoiT account).
- Optionally enable Use Grafana time range to override the report's time settings with the dashboard time picker.
- Set Query type to Query.
- Choose a metric, time interval, and aggregation.
- Add group-by dimensions and filters as needed.
Results are returned as time series frames (one series per group) suitable for time series, bar chart, and stat panels, or as a table for tabular reports. Treemap panels exported by DoiT Console receive a hierarchy frame compatible with the Grafana Treemap panel plugin.
Successful saved-report and ad-hoc query results are cached for six hours per data source instance. Dashboard data can therefore be up to six hours old. API queries run one at a time per data source instance to avoid upstream throttling; additional panel queries wait for the active query to finish. Timed-out queries are not cached; try a shorter time range.
The data source supports Grafana Alerting. Create an alert rule, choose this data source in the query, and add expressions (reduce, threshold) as usual.
- Open an issue for bugs or feature requests.
- DoiT API reference for the underlying Cloud Analytics API.
See CONTRIBUTING.md for local development, build, and test instructions.