Visualizes "energy states" in Python, F#, TypeScript, Kotlin, C++, and C# code as you edit: parts of a file that are complex, deeply nested, or otherwise harder to understand and maintain get highlighted with colored gutter icons, inline decorations, and entries in the Problems panel.
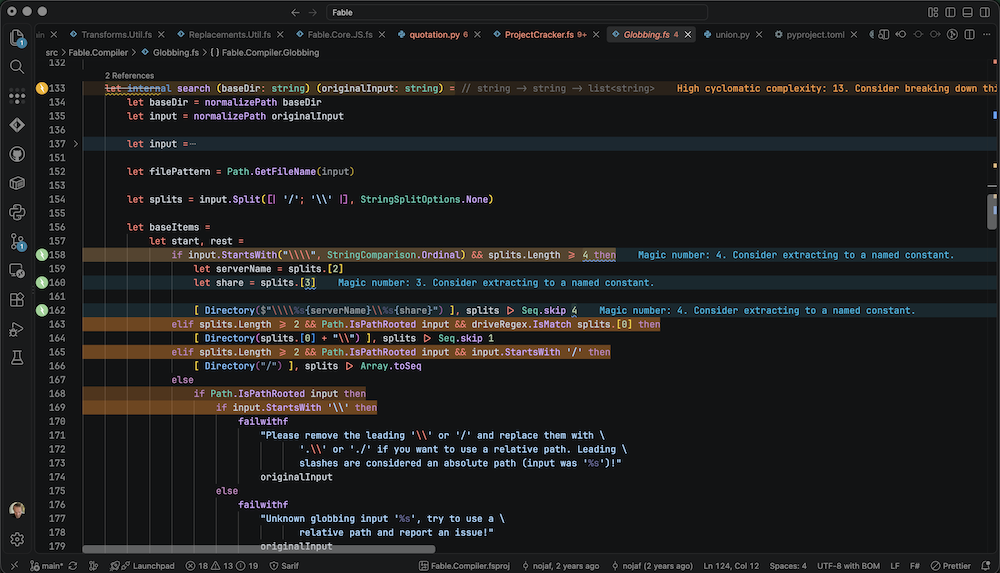
Real-time analysis of the active Python, F#, TypeScript, Kotlin, C++, or C# file, re-run on every edit and on editor focus change, via these detectors (see docs/detectors for full detail on each):
- Cyclomatic complexity, too many independent execution paths.
- Cognitive complexity, too hard to read due to nesting.
- Excessive nesting, control-flow blocks nested too deep.
- File coherence, files that have lost a single responsibility.
- Magic numbers, unnamed numeric literals.
- Magic strings, unnamed string literals at decision points.
- Parameter explosion, functions with too many parameters.
- Broad Protected Scope, overly broad protected try bodies.
- Recovery Dominance, recovery policy that dominates a function.
- Oversized Recovery Block, individual handlers or cleanup bodies exceeding their line limit.
- Inversion opportunities, nested conditionals that could be guard clauses.
- Primitive obsession, strings/numbers standing in for a real type, and boolean blindness.
- Match opportunities, if/elif chains that could be a match/switch.
- Logical operator as control flow, an
ifhidden behind&&/||. - Parse, don't validate, checks whose successful result does not preserve the domain constraint.
- Opaque boolean literal, an unlabeled
true/falseat a call site.
Violations are shown three ways:
- A colored background + gutter lightning-bolt icon on the affected lines (orange = high severity, gold = medium, green = low; colors are configurable, see Extension Settings).
- A hover tooltip explaining the specific violation.
- An entry in the Problems panel, sourced as "Energy State Analyzer".
For functions flagged as too complex (cyclomatic or cognitive), a progressive heatmap in the configured high-energy color (orange by default) is also painted across the function body: each contributing line (an if, for, and, etc.) is shaded from light to dark based on how much it drives up that function's complexity relative to its own worst line, so you can see exactly which branches to break apart first, instead of just knowing the function as a whole is complex.
The energy-state model asks which possibilities a maintainer must distinguish, what knowledge they need, and how relationships in a design allow a change to have unintended consequences. The analyzer highlights selected signs of that work: branching, nesting, broad signatures, implicit meanings, and dependency breadth. These are related signals, not interchangeable quantities on a common scale, and source code has no thermodynamic unit.
Use findings to remove unnecessary possibilities, preserve domain knowledge, and keep change local. Severity communicates the seriousness of the detected readability and maintainability risks under the configured rules. Fix valid findings and document legitimate exceptions; verify that each change improves the code rather than merely lowering a score. See Energy and Entropy for the model, the maintainer's role in interpreting code, and what the metrics reveal.
The same detectors also run headlessly, without VS Code, useful for CI or for an AI coding agent fixing findings in code it just generated and verifying the result:
npx energy-state-analyzer path/to/file.py # or .fs / .fsx / .ts / .kt / .cpp / .csSee docs/cli.md for scanning a whole repo, aggregated markdown/JSON/human reports, and diffing a PR against a base branch. See docs/agent-integration.md for wiring the CLI into an AI coding agent's edit-and-verify loop.
Install the companion skill globally for Claude Code, Pi, and Codex directly from this repository:
npx skills add cardamomcode/energy-state-analyzer \
  --skill energy-state-analyzer --global \
  --agent claude-code --agent pi --agent codex
The skill teaches agents how to shape new code for a clean first scan, interpret the JSON report,
fix valid findings without gaming metrics, and verify the result. Omit --global to install it only
for the current project, or run the command without agent flags to choose targets interactively.
The extension activates automatically when you open a Python, F#, TypeScript, Kotlin, C++, or C# file; it bundles its own grammars for parsing (via web-tree-sitter), so no compiler or external parser is required. F# files only get a fsharp language ID (and so trigger analysis) if you have an F# language extension installed (e.g. Ionide), VS Code otherwise treats .fs files as plain text. The CLI recognizes the full VS Code C++ suffix set, including compound template suffixes such as .hpp.in; see Command-Line Usage.
Product and test sources are F#. Install the pinned .NET tools (Fable and Fantomas) and npm dependencies, then use the wrapped commands:
just setup
just install
just build
just test
Fable emits JavaScript with --lang javascript --noCache into ignored fable-out/; webpack then
creates dist/extension.js and dist/cli.js. just lint checks F# formatting, just format
formats it, and just analyze runs the built F# CLI against the production F# source. Press F5
for the Extension Development Host.
Settings split into two concerns: which detectors run and how they look live in VS Code (editor-only toggles and colors), while how strict each detector is belongs in a project .esaconfig.json shared with the CLI/CI.
Every detector has an enabled toggle, plus the magic-number/string switches and the color palette. All toggles default to true. See each detector's doc (linked under Features above) for what it flags:
energyStateAnalyzer.nesting.enabled(true)energyStateAnalyzer.cyclomaticComplexity.enabled(true)energyStateAnalyzer.cognitiveComplexity.enabled(true)energyStateAnalyzer.coherence.enabled(true)energyStateAnalyzer.matchOpportunity.enabled(true)energyStateAnalyzer.parameterCount.enabled(true)energyStateAnalyzer.primitiveObsession.enabled(true)energyStateAnalyzer.parseDontValidate.enabled(true)energyStateAnalyzer.opaqueBoolean.enabled(true)energyStateAnalyzer.logicalControlFlow.enabled(true)energyStateAnalyzer.inversion.enabled(true)energyStateAnalyzer.errorShadowing.enabled(true, family switch)energyStateAnalyzer.recoveryDominance.enabled(true)energyStateAnalyzer.oversizedRecoveryBlock.enabled(true)energyStateAnalyzer.magicNumber.enabled(true)energyStateAnalyzer.magicString.enabled(true)energyStateAnalyzer.colors.highEnergy/.mediumEnergy/.lowEnergy(#fb8500/#ffb703/#99dd99)energyStateAnalyzer.colors.backgroundOpacity(0.1)
Set thresholds, ratios, and magic-number/string allowlists in an .esaconfig.json file to share them between the editor and CLI/CI — see docs/configuration.md for the schema, per-key defaults, and guidance on choosing thresholds. The keys (all optional; an absent key keeps its default) include:
nesting.mediumThreshold/highThreshold(3/5)cognitiveComplexity.mediumThreshold/highThreshold(15/25)coherence.largeFunctionLines(20),maxLargeFunctions(5),singleDomainNameShare(0.7)matchOpportunity.minBranches(3)parameterCount.mediumThreshold/highThreshold(5/8)errorShadowing.protectedScope.*(threshold/highThreshold/minItems:0.5/0.7/8)errorShadowing.recovery.*(threshold/highThreshold/minItems:0.5/0.7/5)errorShadowing.recoveryBlock.maxLines(20)magicNumber.allowlist([0, 1, -1, 2])magicString.minDuplicates(2),allowlist(["", "utf-8", "__main__"])
The magic-number/string enabled toggles above remain in VS Code — enabling or disabling a detector is an editor-only convenience, so it stays out of the shared project file.
Changes take effect immediately on the active editor.
To exclude files/folders (e.g. test fixtures, generated code) from both the extension's live analysis and the CLI, add a .esaignore file to your workspace root — see docs/cli.md.
- Energy State Analyzer: Analyze Energy State (
energy-state-analyzer.analyze), manually re-run analysis on the active editor. - Energy State Analyzer: Export SARIF Report (
energy-state-analyzer.exportSarif), scan the workspace and write.energy-state/latest.sariffor SARIF-compatible tools.
- Cyclomatic complexity, cognitive complexity, and parameter count analyze anonymous callables in all supported languages. File-coherence analysis still counts only named definitions and methods; direct anonymous-callable bindings are not yet treated as file or class responsibilities.
- C++ analysis is syntax-only: it does not preprocess macros, resolve includes, instantiate templates, or perform type checking. Macro-generated callable syntax is therefore invisible.
- Several detectors have per-language gaps beyond the above, see the "Known limitations" section of the relevant detector doc.