
Never lose your GitHub repository traffic data again! 📈
Please consider giving this project a ⭐ if you find it helpful!
The full Gitlytics ecosystem spans across a few repositories. If you are looking for the core Python API or the web dashboard, check out the links below:
- 🐍 Gitlytics (Core Library): The core Python library, REST API backend, and CLI tools.
- Gitlytics Web Ecosystem: The production landing page, React Dashboard, and React Documentation site.
Warning
The 14-Day Data Loss: By default, GitHub only retains repository traffic data (views and clones) for the latest 14 days. After two weeks, your valuable historical data is permanently deleted and gone forever.
If you want to track your repository's growth, analyze long-term trends, or just keep a permanent record of your project's popularity, you need a way to back up this data regularly.
This automation solves that problem perfectly. Instead of running every day and wasting GitHub Action minutes, it smartly fetches your GitHub traffic data every 13 days. Since GitHub keeps 14 days of history, this creates a perfect 1-day overlap as a safety buffer—meaning 0 wasted minutes and absolutely no data missed!
The repository is structured into three main components to ensure a clean and automated data extraction process:
This folder contains the fetch_traffic.yml workflow file. It uses GitHub Actions to automatically trigger the data extraction script every 13th day at 17:00 UTC (10:30 PM IST). It runs completely in the background without any manual intervention, perfectly optimized to save CI/CD minutes.
The workflow automatically installs and runs the official gitlytics PyPI package to handle the heavy lifting:
- Securely authenticates with the GitHub API using your Personal Access Token.
- Fetches all available traffic data (Views, Clones, Stars, Forks, Unique Visitors).
- Intelligently merges new data with your historical data without any duplicates.
Instead of one massive file, the data is smartly organized into monthly CSV files (e.g., traffic_2024-01.csv). This makes it incredibly easy to read, export, and analyze your data over time.
Choose one of the two options below to set up your traffic tracking:
Add traffic tracking directly to your existing repository.
- Go to GitHub Settings > Developer settings > Personal access tokens > Fine-grained tokens.
- Click Generate new token.
- Select the repository you want to monitor.
- Under Repository permissions, set Administration to Read-only.
- Generate and copy the token.
- In the repository you want to monitor, navigate to Settings > Secrets and variables > Actions.
- Create a new repository secret named
TRAFFIC_TOKENand paste your token.
In your repository, create .github/workflows/traffic.yml and paste the following content:
name: Gitlytics Traffic Sync

on:
  schedule:
    - cron: '0 17 */13 * *'
  workflow_dispatch:

jobs:
  backup:
    runs-on: ubuntu-latest
    permissions:
      contents: write
    steps:
      - name: Checkout Repository
        uses: actions/checkout@v4

      - name: Sync Traffic Data
        uses: ameyac11/gitlytics-action@v1
        with:
traffic_token: ${{ secrets.TRAFFIC_TOKEN }}Keep all your repository traffic databases consolidated in a single, private vault repository.
Click Use this template at the top right of this repository page and select Create a new repository.
Important
Make sure to set the new repository to Private!
Generate a classic GitHub PAT with repo permissions to allow the sync process to fetch your repositories.
- Go to your new private vault repository's settings.
- Navigate to Secrets and variables > Actions.
- Create a new repository secret named
TRAFFIC_TOKENand paste your PAT.
Because the cron schedule runs every 13 days, the folders/CSV files will not appear immediately. To populate your initial traffic data right away:
- Go to the Actions tab in your repository.
- Select the Fetch GitHub Traffic workflow.
- Click the Run workflow button.
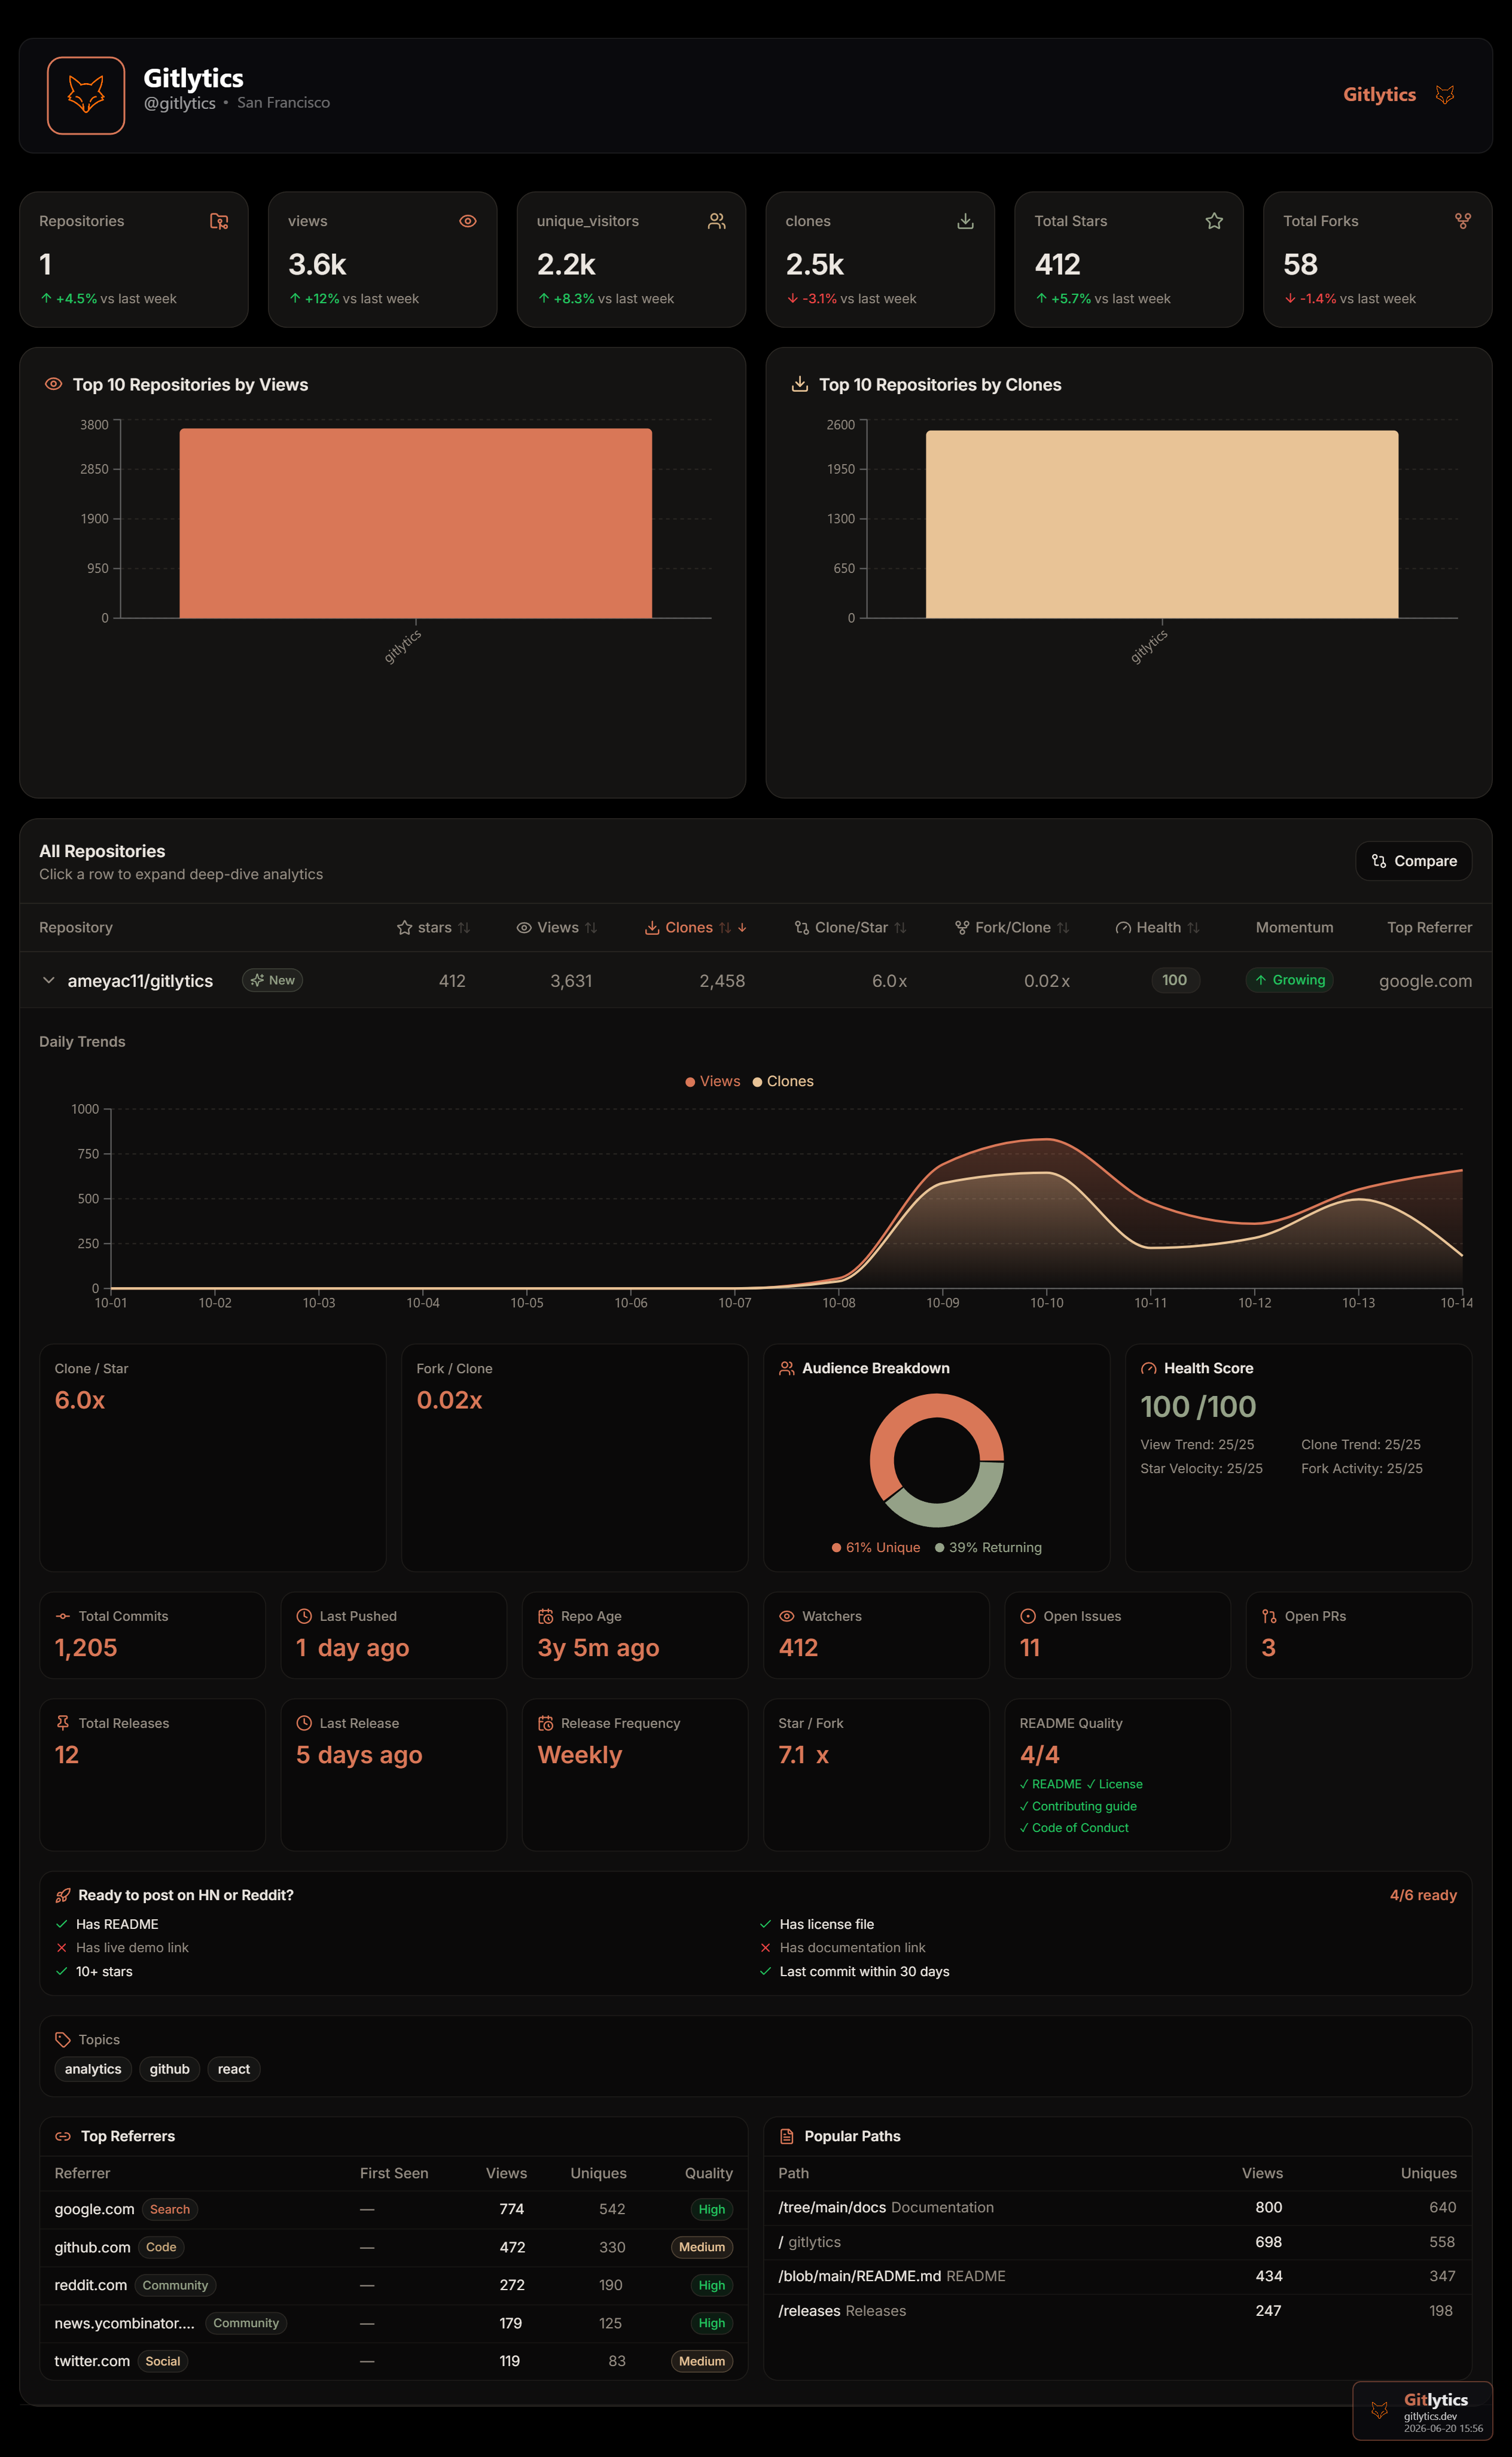
Raw CSV files are great, but visualizing them is even better!
We have built a beautiful production React Dashboard to seamlessly visualize the data generated by this automation.
👉 View the Live Dashboard at dashboard.gitlytics.dev 👉 Read the Full Documentation
How to use it:
- CSV Upload: Directly upload your monthly CSV files generated by this automation into the dashboard to visualize your accumulated historical data.
- Real-time API Fetch: If you want on-demand, real-time traffic stats, you can connect your GitHub account directly using your Personal Access Token (PAT).
This project is licensed under the Apache 2.0 License. See the LICENSE file for more details.