Repository navigation
Calibration improvements from full-scale SANDAG tests - #14
i-am-sijia wants to merge 3 commits into
Conversation


|
@dhensle I found it a bit difficult to navigate through the calibration outputs when there are a large number of calibration coefficients. Would a consolidated HTML like the one attached be helpful? It's automatically generated as part of the calibration run. If so, I can push the code here. |

|
Hi @i-am-sijia, yes! I think a report / visualization like this would be very helpful and the one you supplied looks great! I agree for models that have a lot of coefficients, it can get busy. Also great to have everything from all models in one place. Couple of questions / comments:
|
|
Take two: calibration_report2.zip. I've committed the codes. Re: 1, a small-share mode can show a huge percent error and distort the chart. I think neither percent difference nor absolute difference alone is ideal. I replaced it with the difference divided by each target's tolerance, since the convergence criteria is Re: 2, the creation of the html depends on Re: 3, yes, the "component diagnostics" plots are now shown by default. Let me know if you have additional comments. |


When testing the full-scale SANDAG example model using the newly added calibration configs, the model run crashed after an hour during the tour model choice calibration because the calibration config contained
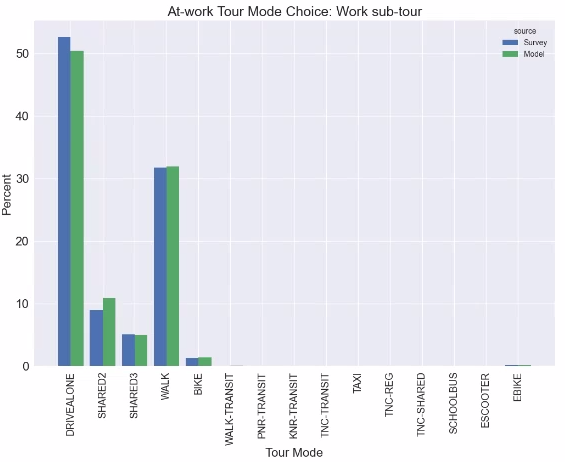
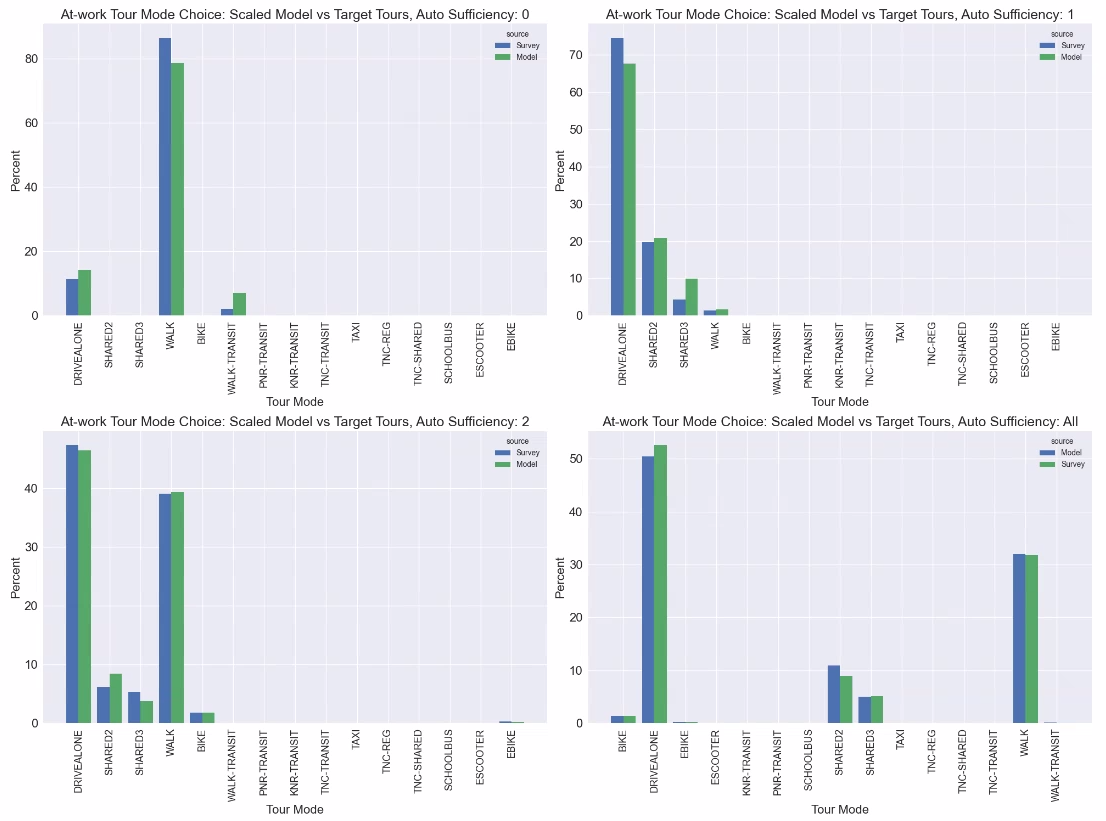
coef_calib_xxxthat were not in thetour_mode_choice.csv. This PR implements a preflight check to validate the calibration configs for all calibration components, and raise mismatched calibration coefficients at the beginning of a calibration-enabled run, instead of waiting for an hour for the run to crash.Calibration results from a full-scale SANDAG example model run with 10,000 households are shown below, using the calibration configs in https://github.com/RSGInc/sandag-abm3-example/tree/calibration. The calibration feature seems to be working as expected.
Auto ownership
Workplace location
Tour mode choice
At-work tour mode choice