A visual tool for inspecting and understanding your Stylelint configuration.
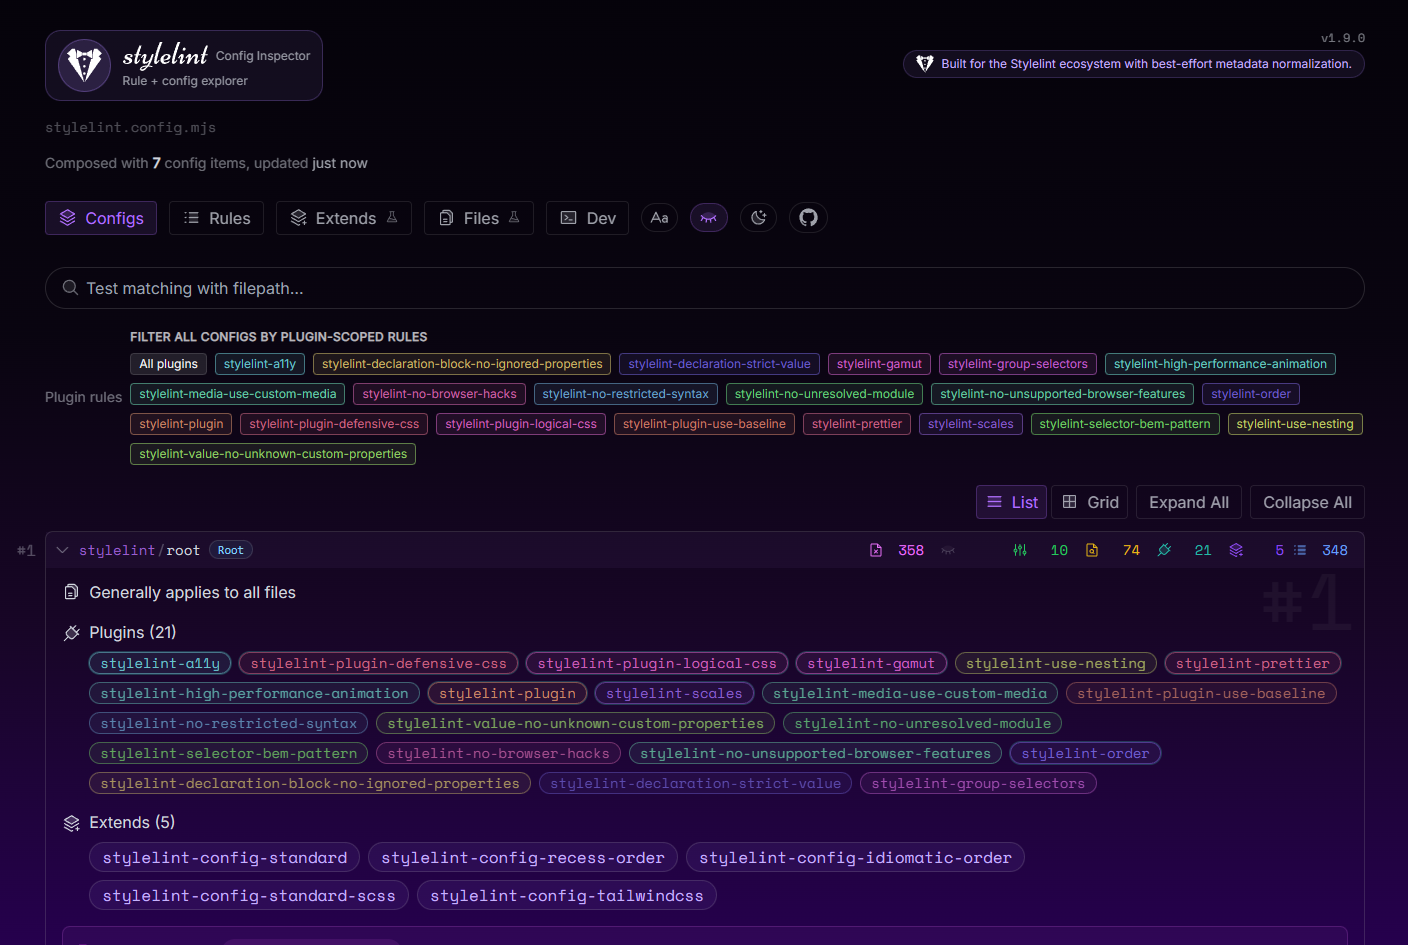
From a project that contains a Stylelint config (stylelint.config.* or .stylelintrc*), run:
npx stylelint-config-inspector@latestThen open http://localhost:8888/ (If it does not open automatically) to explore your config.
Use a target file so Stylelint resolves context-sensitive options (overrides, customSyntax, etc.):
npx stylelint-config-inspector --file src/styles/app.cssIf you do not provide --file or --target, the inspector resolves your config against a synthetic file named stylelint-inspector-target.css relative to the resolved base path.
--file and --target are equivalent.
stylelint-config-inspector [options]
stylelint-config-inspector build [options]--config <configFile>: explicit config file path--basePath <basePath>: root path used for glob resolution--file <filePath>: alias of--target--target <filePath>: file used for effective config resolution--files: include matched file metadata in payload (enabled by default)--stats: start native Stylelint timing analysis immediately, or include its result in a static build
Open Stats and select Run Analysis to profile the workspace, or start an analysis as the inspector opens:
npx stylelint-config-inspector --statsThe Slow Rules and Slow Plugins views rank native rule timings, with expandable plugin breakdowns. The summary shows elapsed run duration, reported rule time, linted files, errors, warnings, and the analysis timestamp. Analysis runs in a separate process with fixes and caching disabled; it does not apply changes to your source files or use the project's lint cache.
Profiling requires the project's Stylelint 16.13 or newer within the supported 16 and 17 major versions. It scans the same configured and common style-related file patterns as the inspector, without the Files page's display limit. Stylelint applies the project's ignores, overrides, and custom syntaxes. The displayed scope is the workspace rooted at the resolved base path: --target controls the configuration preview, not the profiling file selection, and --no-files does not disable profiling.
Timings come from Stylelint's native TIMING support. Percentages use the sum of reported rule timings, not elapsed run duration. Native rule timing does not include time spent waiting in asynchronous plugin rules; elapsed duration also includes startup, configuration loading, parsing, and other work. These results are useful for identifying expensive synchronous rules, not a complete accounting of all elapsed time. Per-file timings and separate parsing/fixing breakdowns are not available.
Reports are snapshots. Configuration updates mark a report stale; use Re-run after changing configuration or source files. A failed rerun preserves the last successful report. Only one analysis runs at a time, with a five-minute timeout.
To generate a static inspector snapshot:
npx stylelint-config-inspector buildThis emits a single-page app in .stylelint-config-inspector.
Include a read-only performance report with:
npx stylelint-config-inspector build --statsThe report is saved as api/stats.json alongside the configuration payload. Static inspectors cannot start or rerun analysis; rebuild the snapshot to refresh it. A build without --stats shows instructions in the Stats tab. An explicitly requested analysis that fails also fails the build.
Both reports and navigation support a deployment prefix:
npx stylelint-config-inspector build --stats --base /tools/stylelint/When inspecting a package inside a monorepo, set the base path for file glob matching and target resolution:
npx stylelint-config-inspector --config stylelint.config.mjs --basePath packages/web --file src/app.cssEnvironment aliases are also supported:
STYLELINT_BASE_PATH(or legacyESLINT_BASE_PATH)STYLELINT_TARGET(or legacyESLINT_TARGET)
Run npx stylelint-config-inspector --help for all options.
See the Playwright testing guide for local and CI commands, the interaction coverage map, responsive checks, and screenshot reports.

Thanks goes to these wonderful people (emoji key):


![dependabot[bot]](https://avatars.githubusercontent.com/in/29110?v=4?s=80)

![github-actions[bot]](https://avatars.githubusercontent.com/github-actions%5Bbot%5D?v=4?s=80)


![renovate[bot]](https://avatars.githubusercontent.com/renovate%5Bbot%5D?v=4?s=80)


