


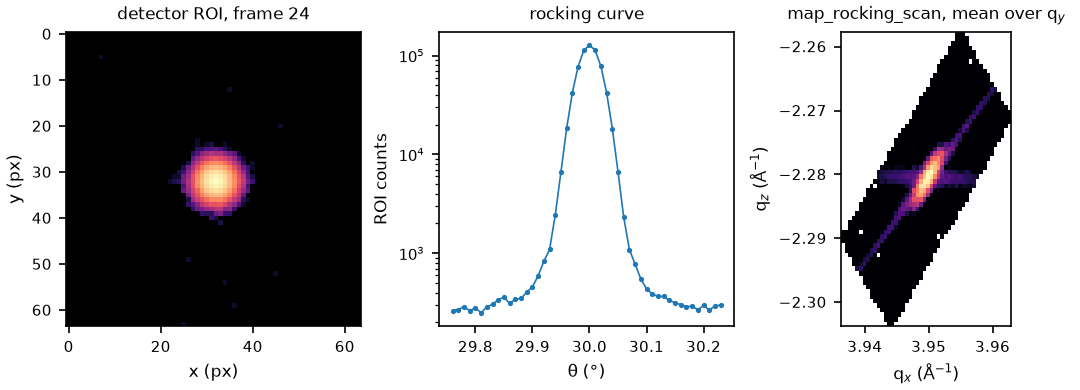
The synthetic scan from examples/synthetic_scan.py: a detector frame, the rocking curve and map_rocking_scan in q-space (script).
Analysis code for coherent X-ray diffraction (CXD) data: SPEC file parsing, Timepix TIFF frame loading, rocking-curve to q-space regridding, and 3D q-space visualization.
In a Bragg coherent X-ray diffraction (BCDI) measurement a small crystal is rocked through a Bragg reflection while an area detector records a coherent diffraction pattern at each angle; the stack of frames samples the 3D diffraction pattern around one reciprocal-lattice point. This package is for reducing such scans recorded with SPEC and a Timepix detector: it reads the scan metadata and frames, maps detector pixels and rocking angles to q, shows the result in 3D, finds facet/streak directions, and sorts reconstructed amplitudes into true and twin-image groups.
Requires uv and Python 3.13 (uv fetches it if missing). Not on PyPI yet: the first release will add pip install cxd, after QoraGeom is released.
1. Clone the repo
git clone https://github.com/NaNIsaac/CXD
cd CXD
2. Install the dependencies
uv sync3. Check that the package imports
uv run python -c "import cxd, qorageom"The SPEC parser, frame loaders and geometry live in QoraGeom (qorageom), installed from git as a dependency. cxd.core.spec re-exports Spec, SpecScan and adds get_positions.
No measured data ships with the repo. examples/synthetic_scan.py writes a synthetic rocking scan to examples/data/: a SPEC file (synthetic.spec, scan 1), its TIFF frames (S0001/) and the ROI stack as .mat (scan_0001.mat). The notebooks and the examples below use it.
uv run python examples/synthetic_scan.pyfrom cxd.core.spec import Spec, get_positions
with Spec("examples/data/synthetic.spec") as sp:
scan = sp.get_scan(1)
scan.motors # {"Theta": ..., "Delta": ..., "Gamma": ...}
scan.sdd # sample-detector distance from #UXML
df = scan.to_dataframe()Regrid a rocking scan into q-space and view it:
from cxd.core.rocking import map_rocking_scan
from cxd.core.visualize import visualize_q_space_vtk

# frames (frame, y, x); thetas per frame and delta, gamma in degrees; sdd, pixel in mm
m = map_rocking_scan(frames, thetas, delta, gamma, (frame0, y0, x0), sdd, pixel, energy_kev)
visualize_q_space_vtk(m.intensity, mode="contour", log=True)
map_rocking_scan computes the q of every (frame, pixel) sample with
QoraGeom's diffractometer conventions (34-ID-C by
default: the detector turns delta about +y after gamma about −x, the sample rocks about th) and
bins them without interpolation. It returns the mean intensity per bin, the number of samples per
bin (hits, 0 = not measured) and the bin edges in 1/Å (2π included). The (frame, y, x) of the
reference is the pixel the detector arm points at and the frame that defines the crystal frame.
The lab directions of the detector columns and rows are an orientation argument and depend on
the instrument.
The older correct_rocking puts the detector on the direct beam (it ignores 2θ, δ and γ), so
the rocking sweep collapses (#10). It still returns
what it did, with a DeprecationWarning, so earlier analyses can be reproduced.
Neither q-space grid is meant for phase retrieval. Hand the rocking stack to QoraPhase in detector frame instead:
import qoraphase as qp
from cxd.core.handoff import to_qoraphase

intensity, mask, offset = to_qoraphase(stack, 64, bad=gaps)  # stack: (frame, y, x) counts
result = qp.CDI(intensity=intensity, mask=mask).reconstruct(recipe)| CXD side | QoraPhase side | |
|---|---|---|
| Axes | (frame, y, x): rocking first, detector rows, detector columns |
any 3D shape; no axis meaning |
| Origin | Bragg peak anywhere in the stack | peak at index n // 2 of each axis (to_qoraphase crops around it) |
| Values | counts, any dtype | float intensity (not amplitude) |
| Mask | bad: True = unusable (detector gaps, hot, saturated) |
mask: True = unusable; NaN/Inf are refused even when masked, so masked voxels are zero-filled |
| Negative / NaN / Inf | allowed in stack |
masked by to_qoraphase, not clipped |
| Coordinates | offset = first voxel of the crop in stack |
none; the voxels stay detector-frame |
cxd.mapping.qspace uses the opposite mask polarity (True = kept). The reciprocal-space basis
of the detector-frame voxels (from the SPEC geometry, e.g. QoraGeom) is not computed here and has
to be kept with the result to map the reconstruction to lab or sample axes.
tests/test_handoff.py reconstructs a synthetic scan through this path.
Scripts take their inputs as arguments (--help lists them). Run from the repo root:
uv run python -m scripts.prep_frames examples/data/S0001 examples/data/scan_0001.npy
uv run python -m scripts.streak_profiles examples/data/scan_0001.mat --save-dir out --energy 8 --delta 60
uv run python -m scripts.orientation_map <roi.mat> --energy <keV> --tth <deg> --sdd <mm>
uv run python -m scripts.analyze_raw <specfile> <data_dir> <npy_folder> <run> [<run> ...]
Plots that need only a SPEC file (rocking curves, FWHM vs Q, gamma/delta check, mesh maps) are in splotter.
- docs/index.md: the overview the documentation site builds from, with a first run of its own.
- docs/perf.md: time and memory of the regridding step on synthetic volumes.
- QoraGeom: the SPEC parser, frame loaders and diffractometer geometry CXD builds on.
- QoraPhase: phase retrieval, for the handoff described in Quick start.
Current implementation: CXD provides coherent-diffraction scan analysis and visualization, plus experiment-specific SPEC/Timepix workflows. It currently uses QoraGeom for geometry and some SPEC/frame reading; cxd.core.spec exposes legacy import paths. The examples above use that current API.
Direction: keep numerical analysis/regridding interfaces usable on arrays and structured metadata independently of SPEC and detector file formats. Put instrument-specific loaders and conversion steps at the application/adapter boundary. Coordinate with QoraGeom's planned I/O separation; preserve existing imports until migration is tested.
Separate application: QoraFlow is an integrated experimental data-reduction pipeline and is not required to follow the same pure-library boundary.
All test data is synthetic; no measured data ships with the repository.
examples/synthetic_scan.pywrites a seeded rocking scan: a SPEC file, TIFF frames and a.matROI.tests/test_pipeline.pyruns it throughSpec,load_tif_stack,calculate_qspace_paramsandto_qoraphase. It checks the q steps against their closed form (k·p/L on the detector, |Q|·Δω along the rocking axis) and pins the counts, peak position and crop as a regression snapshot.tests/test_handoff.pyreconstructs a synthetic scan with QoraPhase after the handoff.- Known limits:
src/cxd/core/spec.py-get_positions;Spec,SpecScanfromqorageom.specsrc/cxd/core/rocking.py- rocking scan to q with the detector angles (QoraGeom), binned with edgessrc/cxd/core/transform.py-correct_rocking, kept for reproducing earlier resultssrc/cxd/core/handoff.py-to_qoraphase: detector-frame crop and mask for QoraPhasesrc/cxd/core/visualize.py- PyVista 3D q-space viewersrc/cxd/mapping/spherical.py- (cos θ, φ) histogram around the CoM, DBSCAN streak directionssrc/cxd/mapping/profiles.py- thick line profiles along paired opposite directionssrc/cxd/mapping/profiles_view.py- matplotlib plots of those profilessrc/cxd/mapping/vtk_view.py- VTK render of the pattern in reciprocal-space coordinatessrc/cxd/mapping/qspace.py- isotropic q resampling, central-peak mask, r²-weighted θ/φ orientation map, local-max peakssrc/cxd/mapping/orientation_view.py- Lambert projection and PyVista 3D view of the orientationssrc/cxd/twin_finder.py- split reconstructed amplitudes into true/twin groups (FFT cross-correlation + KMeans)scripts/-prep_frames,analyze_raw,streak_profiles,orientation_map,bench_rsm
uv run pytest
See CITATION.cff.
MIT, see LICENSE.