Repository navigation
Add tutorial for plotting datetime inputs #549

Description

Description of the desired feature
Following on from #464, we'll need help adding a gallery/tutorial on how to pass in datetime inputs to plot!
Simple goal (gallery example):
Start by taking a look at the top post of #464. The example should cover at least 4 types of Python datetime inputs:
- numpy.datetime64
- pandas.DateTimeIndex
- Raw datetime strings in both ISO and non-ISO formats, e.g.,
2010-01-01,1/1/2018,Jul 5, 2019 - Python's built-in datetime and date
You can adapt the example from the following code:
pygmt/pygmt/tests/test_plot.py
Lines 294 to 325 in a2258a5
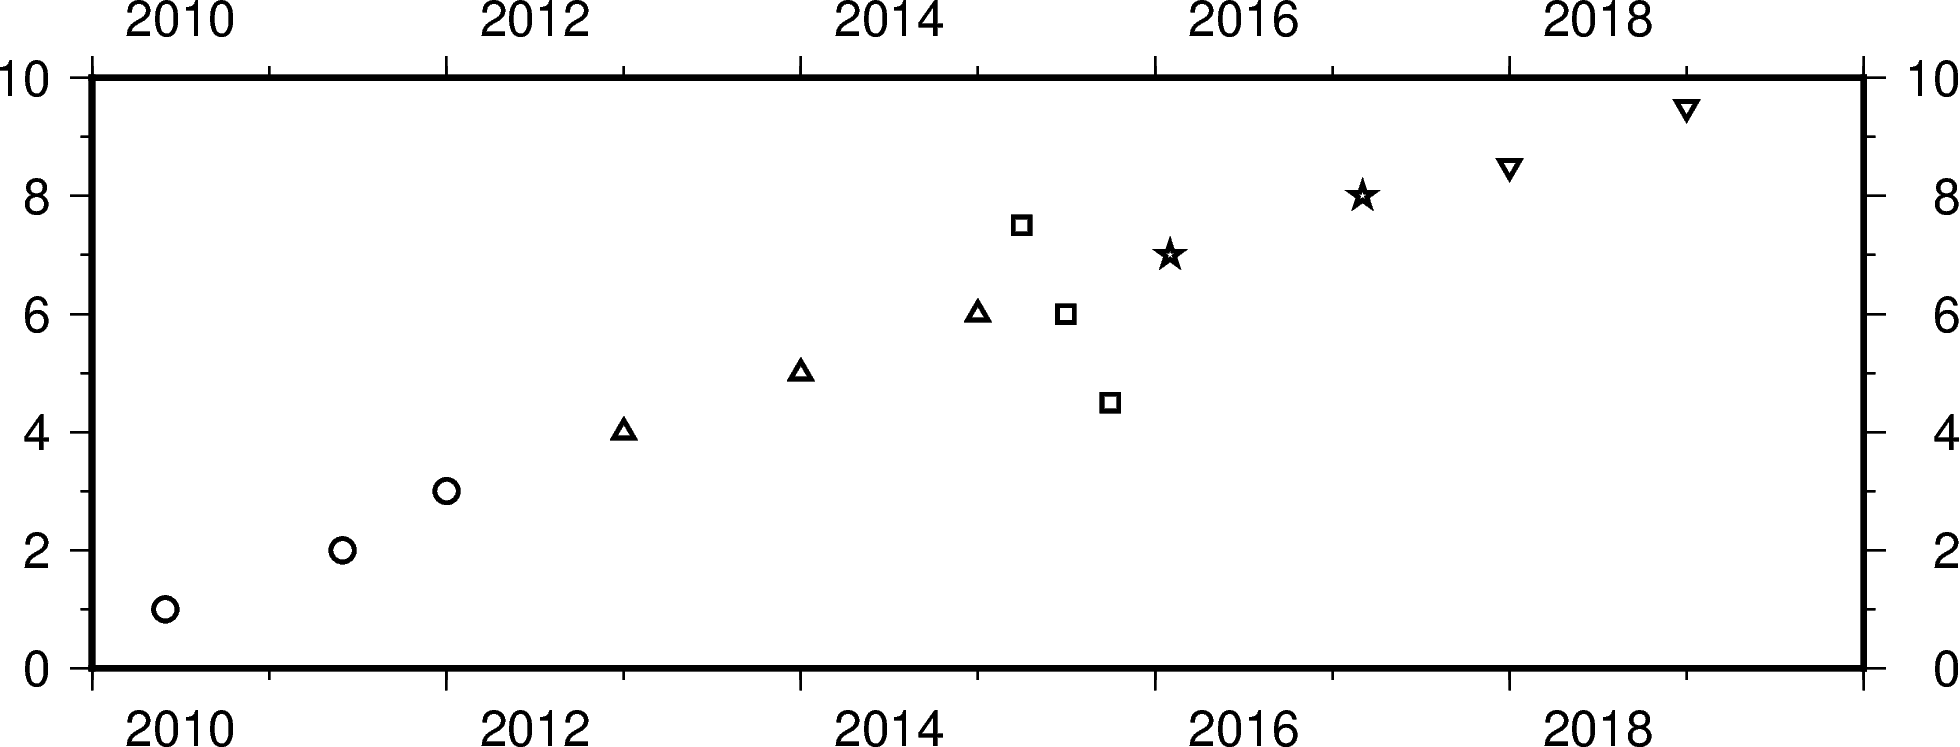
It would also be good to show how datetime-like arguments can be passed in the 'region' argument of fig.basemap, see #562.
Stretch goal (full tutorial)
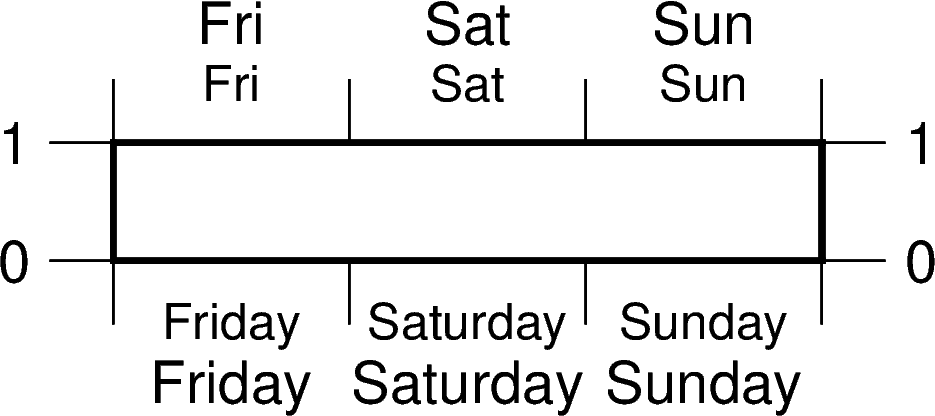
Learn how to use pygmt.config to configure Calendar/Time Parameters!
This is a bit more involved, but you can do amazing stuff like abbreviate Sunday to Sun. Example code/figure:
pygmt/pygmt/tests/test_config.py
Lines 77 to 90 in a2258a5
See also GMT Gallery Example 21 "Time-series of RedHat stock price" at https://docs.generic-mapping-tools.org/6.1/gallery/ex21.html for what is possible!
Are you willing to help implement and maintain this feature? Let's have someone new tackle this!
Activity
Create gallery example for datetime inputs
michaelgrund commentedon Jan 29, 2021
As the gallery example was merged into master in #779 could you adjust the issue title @weiji14 to only address the missing tutorial?
[-]Add a Gallery/Tutorial example for plotting datetime inputs[/-][+]Add a Tutorial example for plotting datetime inputs[/+][-]Add a Tutorial example for plotting datetime inputs[/-][+]Add tutorial for plotting datetime inputs[/+]weiji14 commentedon Apr 6, 2021
Continuing from #1078 (comment) (ping @munzekm, @noorbuchi, @cklima616, @nathandloria), I think adding a datetime tutorial would be a nice follow up to #1070 since you're already familiar with how to write up a tutorial for PyGMT. There's a few challenging aspects to it, but I'm sure that a team of three will make short work of it! These are some sections you could do (but do feel free to come up with new ideas):
fig.basemap, see also https://www.pygmt.org/v0.3.1/gallery/symbols/datetime_inputs.htmlpygmt.infoto get the min/max time for passing into theregionparameter, but note potential bug at Running info on pandas.DataFrame with time column doesn't work #597As usual, free to ask any questions, and/or start a draft PR to work on this issue. And thanks again for your continued contributions!
munzekm commentedon Apr 7, 2021
Thank you @weiji14 for the information about this issue. We would be happy to start working on it. We do have a few questions: Would you want us to create a new python file inside the tutorial folder or use an existing one? Do you want us to work on the existing gallery file as well? Also, how would you like us to set up this tutorial. Our group just wants to make sure we fully understand what we are focusing on.
weiji14 commentedon Apr 7, 2021
Please make a new python file for the tutorial, and no, the existing gallery example doesn't need to be worked on.
The tutorial is intended to walk someone new to make a date-time plot for time-series data. Feel free to discuss within the group and structure things as you see fit (since you're all new to datetime plotting in PyGMT, presumably you would have a list of things you want to know about how to plot time-series data). To be honest, we don't have a strict set of rules on how it needs to be done. But if you're looking for ideas, check out the other tutorials like https://www.pygmt.org/v0.3.1/tutorials/text.html, and see #549 (comment) for suggestions on what could be included.