You signed in with another tab or window. Reload to refresh your session.You signed out in another tab or window. Reload to refresh your session.You switched accounts on another tab or window. Reload to refresh your session.Dismiss alert
{{ message }}
Repository navigation
Add categorical colorbars for plot and plot3d gallery examples #1259
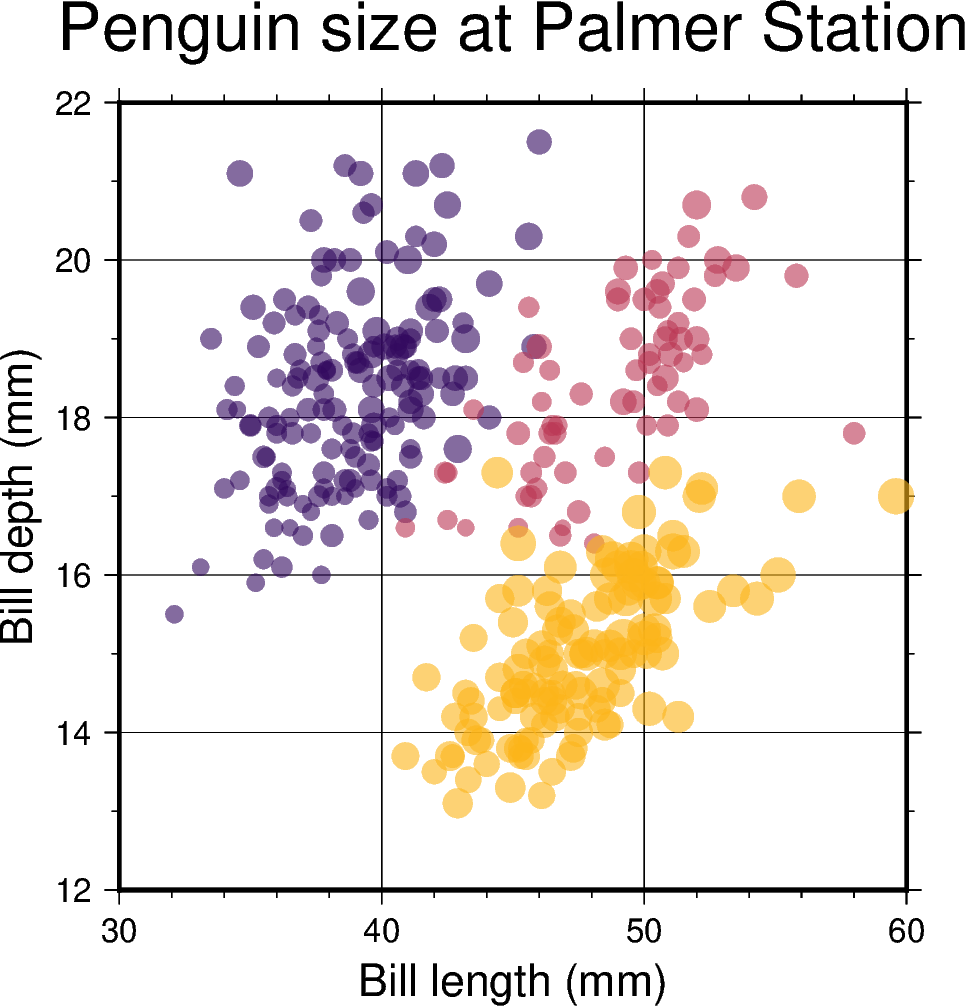
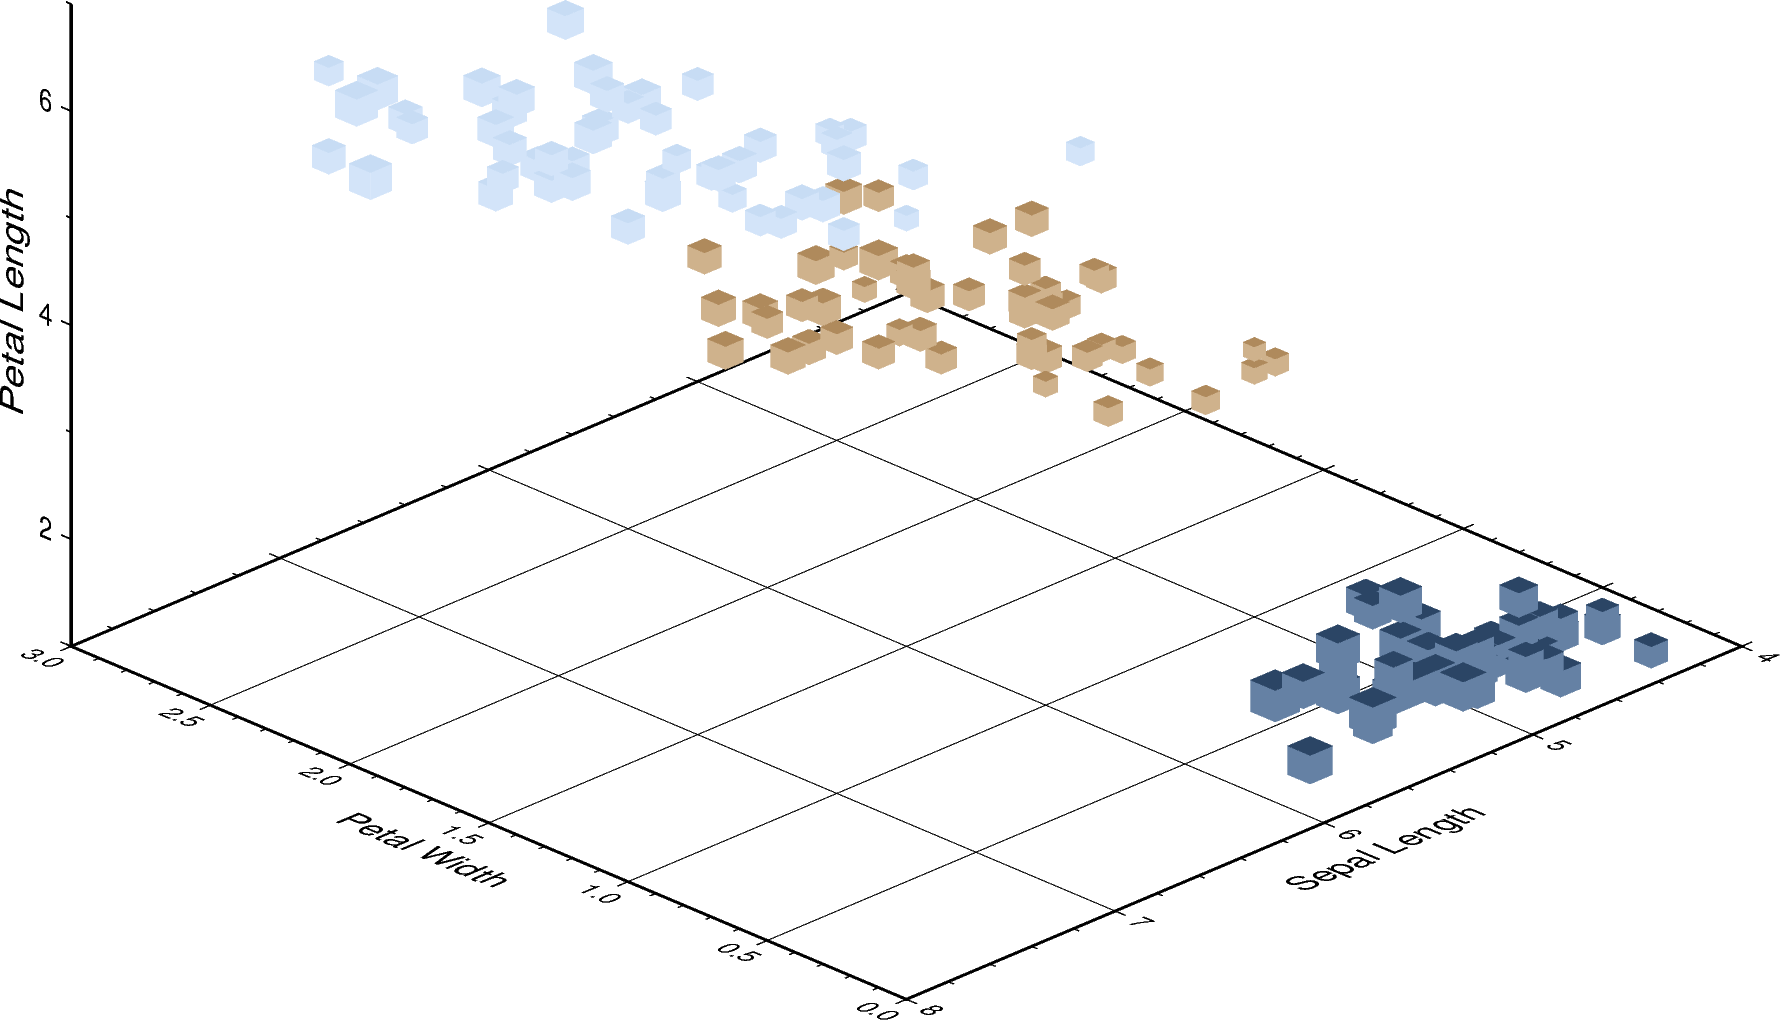
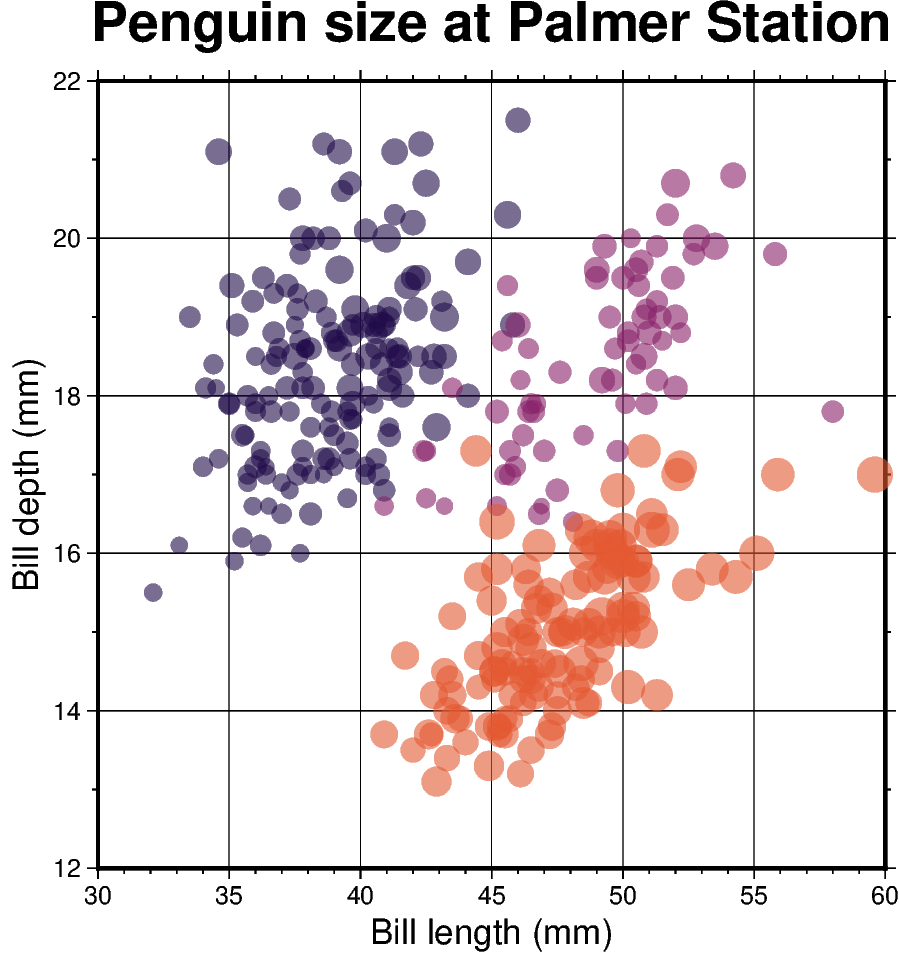
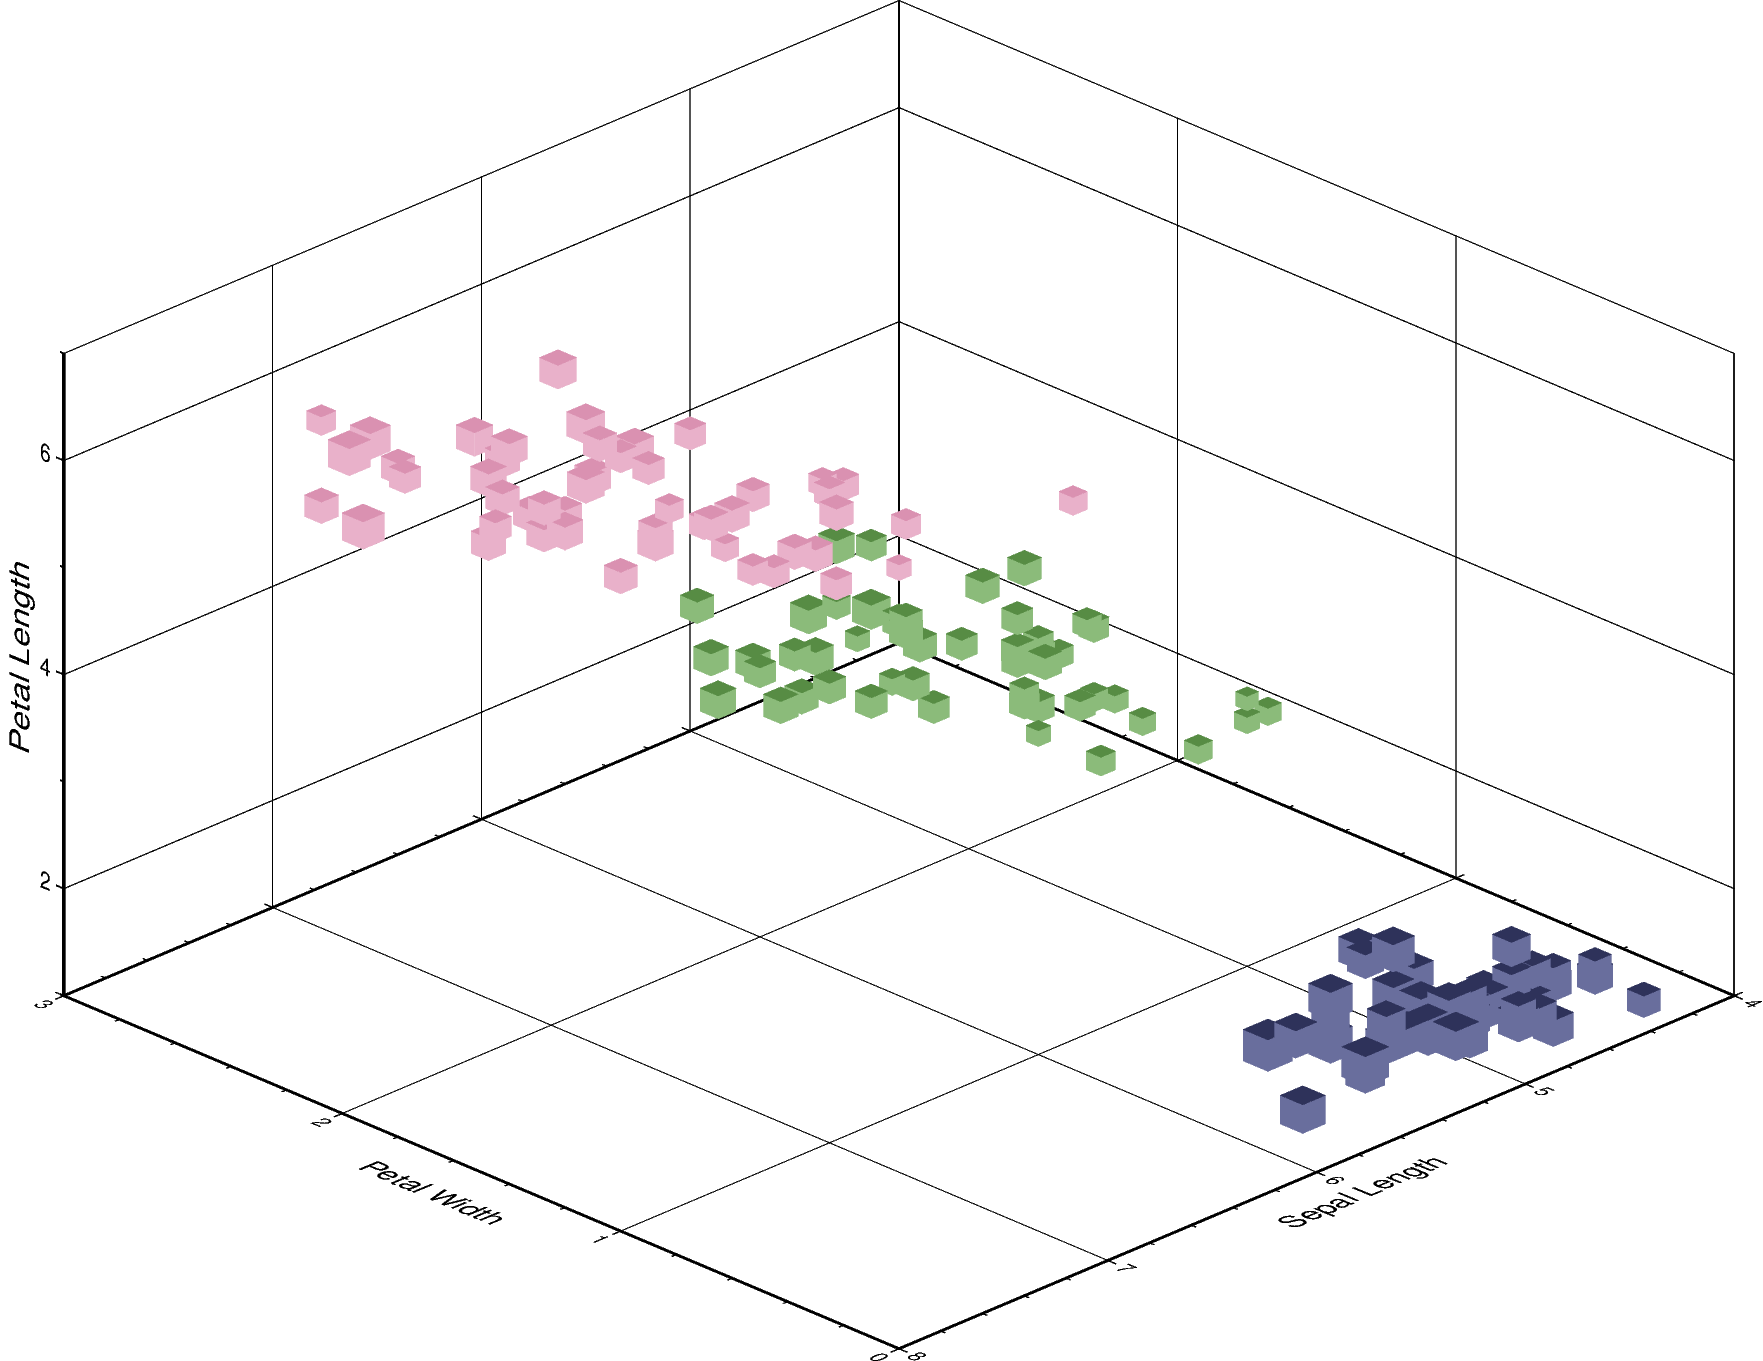
I recognized that some colors of individual gallery examples produced with 6.2.0rc1 show deviations compared to the versions generated with 6.1 (see below). Any ideas what's the reason for that?
The generated CPTs are different. I think there were some CPT-related changes in upstream GMT. The one generated by GMT 6.2.0rc1 makes more sense to me.
GMT 6.1.1:
$ gmt makecpt -Cinferno -T0/3/1 -F+c
0 50.998/10/94.499 L
1 187/54.5/84.5 L
2 251.5/181/25.002 B
B black
F white
N 127.5
GMT 6.2.0rc1:
$ gmt makecpt -Cinferno -T0/3/1 -F+c
0 32.75/12/73.75 L
1 137.25/34/106 L
2 227.37/89.375/50.25 L
3 249/201.25/50.375 B
N 128
Yes, the previous CPT range was considered a bug that was fixed in this PR: GenericMappingTools/gmt#4446. I think we should update the series settings for makecpt accordingly in the examples.
I think we should update the series settings for makecpt accordingly in the examples.
I agree. I think we also need to add a colorbar to these examples. We didn't do that before, because GMT 6.1.1 has some bugs/limitations when plotting categorical colorbars, which should be fixed in GMT 6.2.0rc1.
I think we should update the series settings for makecpt accordingly in the examples.
I agree. I think we also need to add a colorbar to these examples. We didn't do that before, because GMT 6.1.1 has some bugs/limitations when plotting categorical colorbars, which should be fixed in GMT 6.2.0rc1.
Agreed. Are you interested in updating the examples @michaelgrund? I can submit a PR if you are not interested or do not have time.
I will work on that the upcoming weekend and will open a corresponding PR @meghanrjones.
changed the title [-]Color deviations after switching to GMT 6.2.0rc1[/-][+]Add categorical colorbars for plot and plot3d gallery examples[/+]on May 9, 2021
Activity
seisman commentedon May 5, 2021
The generated CPTs are different. I think there were some CPT-related changes in upstream GMT. The one generated by GMT 6.2.0rc1 makes more sense to me.
GMT 6.1.1:
GMT 6.2.0rc1:
maxrjones commentedon May 5, 2021
Yes, the previous CPT range was considered a bug that was fixed in this PR: GenericMappingTools/gmt#4446. I think we should update the
seriessettings formakecptaccordingly in the examples.seisman commentedon May 5, 2021
I agree. I think we also need to add a colorbar to these examples. We didn't do that before, because GMT 6.1.1 has some bugs/limitations when plotting categorical colorbars, which should be fixed in GMT 6.2.0rc1.
maxrjones commentedon May 5, 2021
Agreed. Are you interested in updating the examples @michaelgrund? I can submit a PR if you are not interested or do not have time.
michaelgrund commentedon May 6, 2021
I will work on that the upcoming weekend and will open a corresponding PR @meghanrjones.
[-]Color deviations after switching to GMT 6.2.0rc1[/-][+]Add categorical colorbars for plot and plot3d gallery examples[/+]WIP: Add categorical colorbars for plot and plot3d gallery examples