The python validation engine (pyvale) is your virtual engineering laboratory: An all-in-one package for sensor uncertainty quantification simulations, experimental design/sensor placement optimisation and simulation calibration/validation. Used to simulate experimental data from an input multi-physics simulation by explicitly modelling sensors with realistic uncertainties. Useful for experimental design, sensor placement optimisation, testing simulation validation metrics and virtually testing digital shadows/twins.
We are actively developing dedicated tools for simulation and uncertainty quantification of imaging sensors including digital image correlation (DIC) and infra-red thermography (IRT). Check out the documentation to get started with some of our examples.
We recommend installing pyvale into a virtual environment of your choice as pyvale requires python 3.13. If you need help setting up your virtual environment and installing pyvale head over to the installation guide in our docs.
pyvale can be installed from pypi:
pip install pyvaleBelow is a really quick example for setting up a DIC calculation. It's highly likely that your case will require a more tailored calculation configuration.
For further details please see the DIC examples, theory guide, user guide and API.
Define the Region of Interest (ROI):
import pyvale.dic as dic

roi = dic.RegionOfInterest(ref_image="image0000.tiff")
roi.interactive_selection()
run the DIC:
# use dic.calculate_3d for stereo
dic.calculate_2d(reference="image0000.tiff",
                 deformed="image*.tiff",
                 roi_mask=roi.mask, # built using ROI tool
                 seed=roi.seed, # built using ROI tool
                 subset_size=21,
                 subset_step=10)
Import the results for any analysis/plotting:
dicdata = dic.import_2d(data="dic_results*.csv", # default result files prefix
                        delimiter=",")


import matplotlib.pyplot as plt
plt.pcolor(dicdata.ss_x,
           dicdata.ss_y,
           dicdata.u_px[0]) # horizontal displacement for 0th image
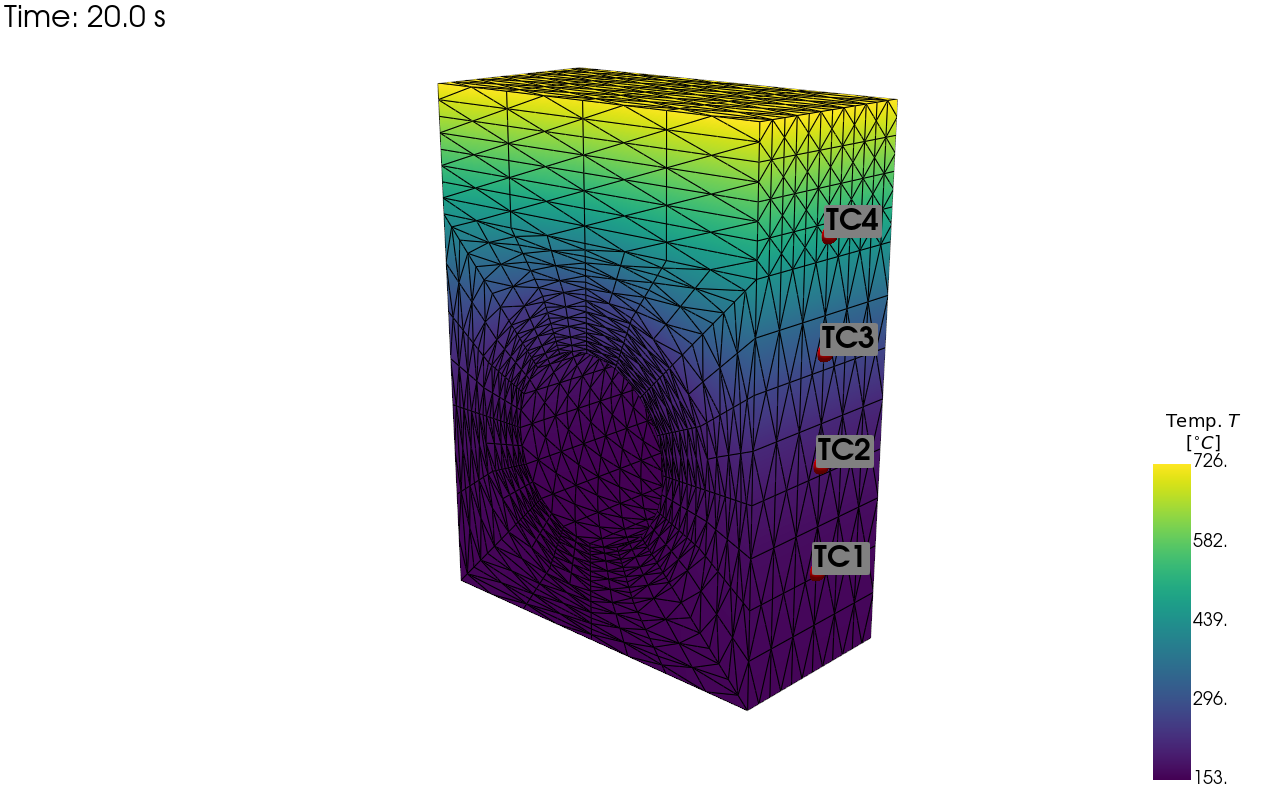
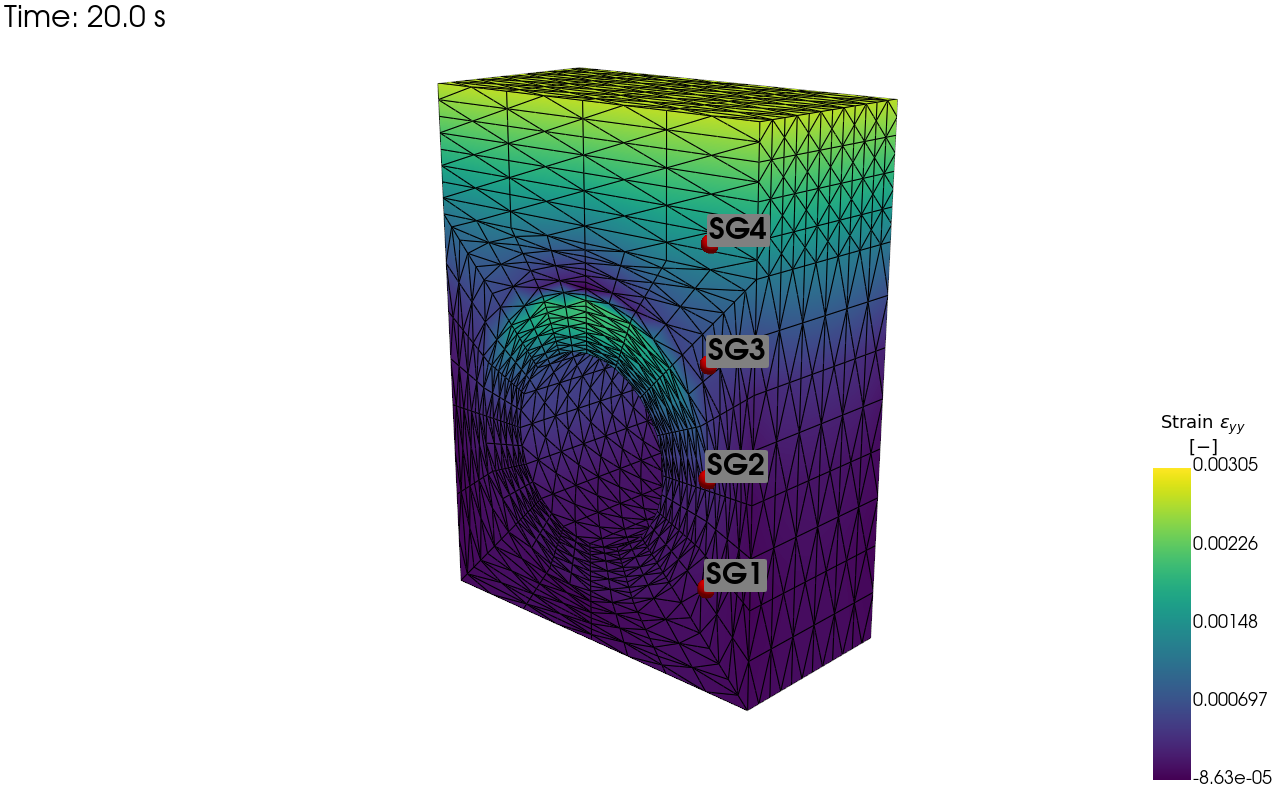
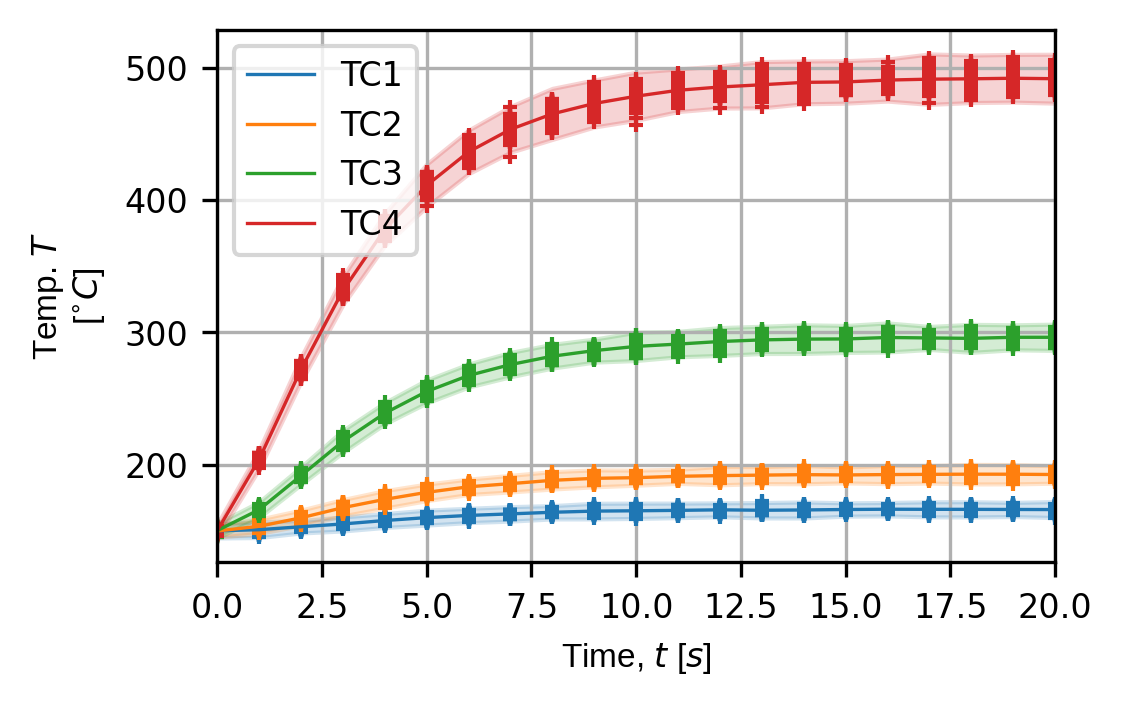
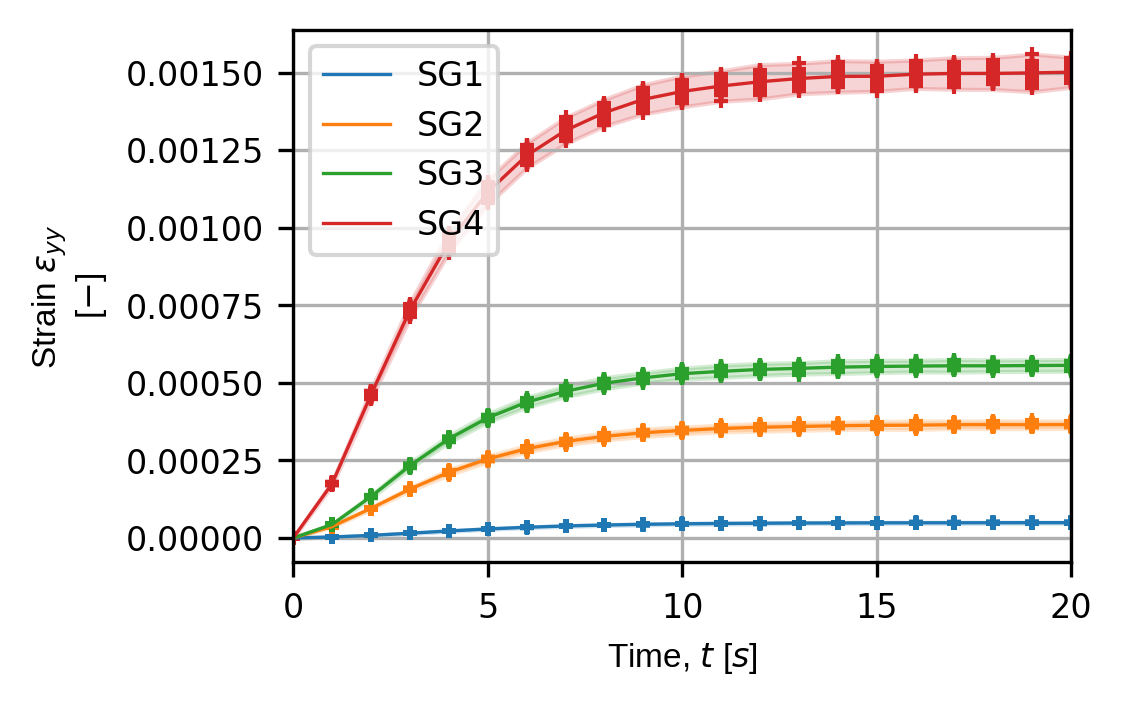
plt.show()/pyvale can be used to simulate thermocouples and strain gauges applied to a MOOSE thermo-mechanical simulation of a fusion divertor armour heatsink. The figures below show visualisations of the virtual thermocouple and strain gauge locations on the simualtion mesh as well as time traces for each sensor over a series of simulated experiments.
The code to run the simulated experiments and produce the output shown here comes from this example. You can find more examples and details of pyvale python API in the pyvale documentation.
 |
 |
|---|---|
| Visualisation of the thermocouple locations. | Visualisation of the strain gauge locations. |
 |
 |
|---|---|
| Thermocouple time traces over a series of simulated experiments. | Strain gauge time traces over a series of simulated experiments. |
The Computer Aided Validation Team at UKAEA:
- Lloyd Fletcher (ScepticalRabbit), UK Atomic Energy Authority
- Joel Hirst (JoelPhys), UK Atomic Energy Authority
- Lorna Sibson (lornasibson), UK Atomic Energy Authority
- Megan Sampson (meganasampson), UK Atomic Energy Authority
- Wiera Bielajewa (WieraB), UK Atomic Energy Authority
- Chris Dawson (ctdaws), UK Atomic Energy Authority
- Michael Darcy (AnalogArnold), Swansea University
- Rob Hamill (rob-hamill), UK Atomic Energy Authority
- Michael Atkinson (mikesmic), UK Atomic Energy Authority
- Adel Tayeb (3adelTayeb), UK Atomic Energy Authority
- Alex Marsh (alexmarsh2), UK Atomic Energy Authority
- Rory Spencer (fusmatrs), UK Atomic Energy Authority
- John Charlton (coolmule0), UK Atomic Energy Authority